Understanding Data — NCERT Solutions
Himachal Pradesh Board · Class 12 · Computer Science
NCERT Solutions for Understanding Data, Himachal Pradesh Board Class 12 Computer Science: 10 textbook questions solved step by step.
Interactive on Super Tutor
Studying Understanding Data? Get the full interactive chapter.
Quizzes, flashcards, AI doubt-solver and a step-by-step study plan — built for NCERT solutions and more.
Free trial, no card needed.
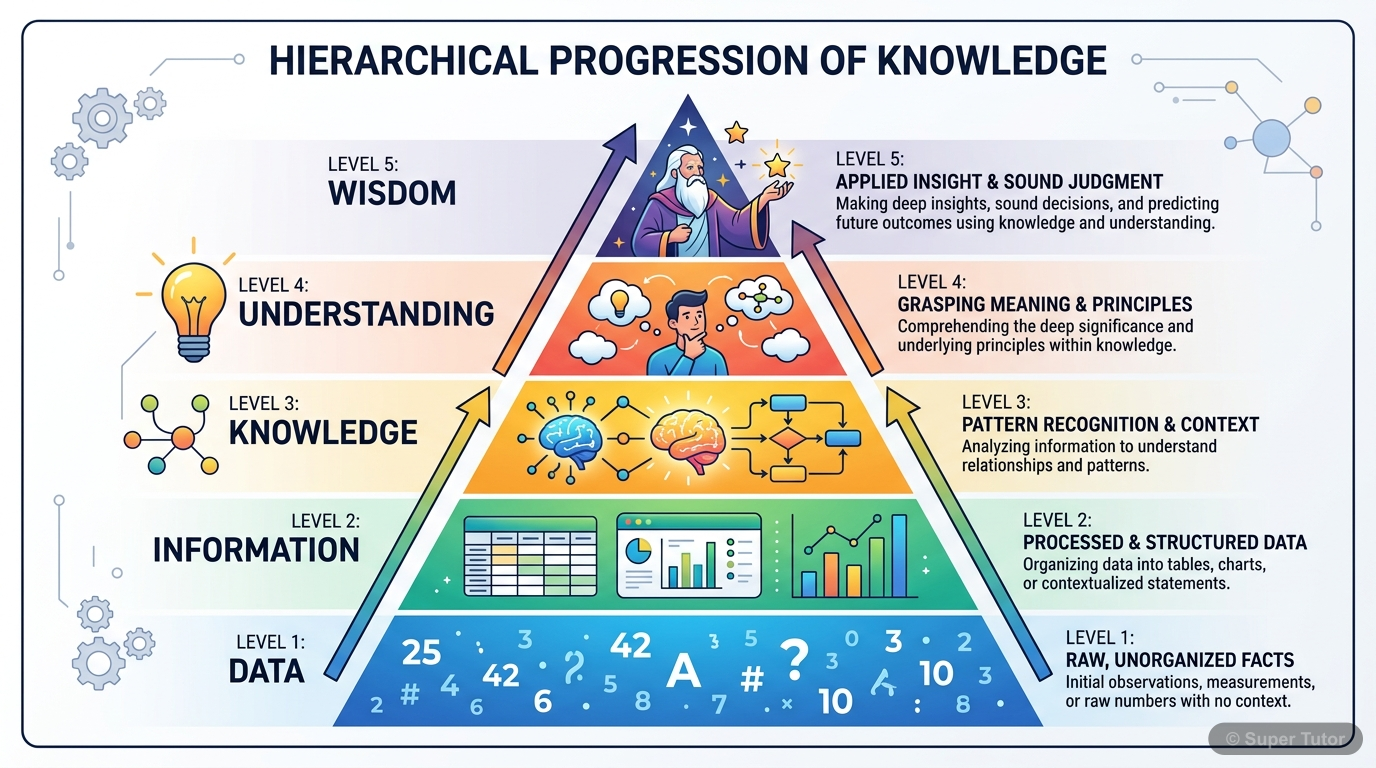
Learn better with visuals Super Tutor pairs illustrations like this with notes and quizzes for Understanding Data.
The first 5 solutions are open to read. The other 5 are free with a Super Tutor account.
EXERCISE — Chapter 7: Understanding Data
1Identify data required to be maintained to perform the following services:
a) Declare exam results and print e-certificates
b) Register participants in an exhibition and issue biometric ID cards
c) To search for an image by a search engine
d) To book an OPD appointment with a hospital in a specific departmentShow solution
Given: Various services that require data maintenance.
Concept: Data is a collection of facts, numbers, characters and symbols needed to perform a specific task or service.
a) Declare exam results and print e-certificates:
Data required:
- Student's full name, roll number, date of birth
- Subject names and marks obtained in each subject
- Maximum marks per subject
- Pass/fail criteria (minimum passing marks)
- School/Board name, exam year
- Student's photograph (for e-certificate)
- Unique certificate ID / serial number
- Digital signature or QR code data for verification
b) Register participants in an exhibition and issue biometric ID cards:
Data required:
- Participant's full name, age, gender
- Contact details (phone number, email address)
- Organisation/Institution name
- Category of participation (visitor, exhibitor, judge, etc.)
- Biometric data: fingerprint scan and/or iris scan
- Photograph of the participant
- Unique participant ID / registration number
- Date and duration of participation
c) To search for an image by a search engine:
Data required:
- Image file (pixel data, colour values, resolution)
- Metadata of the image: file name, file size, format (JPEG, PNG, etc.)
- Tags, labels, or keywords associated with the image
- URL / source location of the image
- Alt text or caption associated with the image on the web page
- Date of upload/indexing
- Image features extracted by AI (shapes, colours, objects detected)
d) To book an OPD appointment with a hospital in a specific department:
Data required:
- Patient's full name, age, gender, contact number
- Patient ID / Aadhar number (for existing patients: medical history)
- Department name (e.g., Cardiology, Orthopaedics)
- Name of the preferred doctor
- Available appointment slots (date and time)
- Reason for visit / symptoms
- Insurance details (if applicable)
- Appointment confirmation number
2A school having 500 students wants to identify beneficiaries of the merit-cum-means scholarship, achieving more than 75% for two consecutive years and having family income less than 5 lakh per annum. Briefly describe data processing steps to be taken to prepare the list of beneficiaries.Show solution
Given:
- Total students = 500
- Scholarship criteria:
- Marks > 75% in two consecutive years, AND
- Family income < ₹5,00,000 per annum
Concept: Data Processing Cycle — Input → Storage → Processing → Output
Step 1 — Data Collection (Input):
- Collect academic records of all 500 students for the last two consecutive years (marks/percentage obtained).
- Collect family income certificates or income declaration forms from all students.
- Collect basic student details: name, roll number, class, section.
Step 2 — Data Storage:
- Store all collected data in a structured format (e.g., a database or spreadsheet) with fields such as:
- Student Name, Roll No., Class
- Percentage in Year 1, Percentage in Year 2
- Annual Family Income
Step 3 — Data Validation:
- Verify that the income certificates are authentic (issued by a competent authority).
- Check that marks/percentage data is correctly entered and matches official records.
Step 4 — Data Processing (Filtering/Querying):
- Apply the first filter: Select students where Percentage in Year 1 > 75% AND Percentage in Year 2 > 75%.
- Apply the second filter on the result: Select students where Annual Family Income < ₹5,00,000.
- Students satisfying both conditions are the eligible beneficiaries.
This can be done using a database query such as:
Step 5 — Output Generation:
- Generate the final list of eligible students with their names, roll numbers, percentages, and family income.
- The list can be printed or published as the official scholarship beneficiary list.
Step 6 — Review:
- The list is reviewed by the school administration for final approval before announcing the scholarship.
3A bank 'XYZ' wants to know about its popularity among the residents of a city 'ABC' on the basis of number of bank accounts each family has and the average monthly account balance of each person. Briefly describe the steps to be taken for collecting data and what results can be checked through processing of the collected data.Show solution
Given:
- Bank: XYZ
- City: ABC
- Parameters: Number of bank accounts per family, Average monthly account balance per person
Concept: Data collection → Processing → Analysis to derive meaningful information.
Steps for Data Collection:
- Define the target population: Identify all families/residents of city ABC who are existing or potential customers.
- Choose a data collection method:
- Primary data: Conduct surveys (online or door-to-door questionnaires) asking residents about the number of accounts they hold with Bank XYZ and their approximate monthly balance.
- Secondary data: Use the bank's internal database of existing account holders in city ABC.
- Design the data collection form/questionnaire with fields such as:
- Family ID / Respondent Name
- Number of accounts held in Bank XYZ
- Number of accounts held in other banks
- Average monthly balance maintained in Bank XYZ
- Type of accounts (Savings, Current, FD, etc.)
- Sample selection: If surveying all residents is not feasible, select a representative random sample from different localities of city ABC.
- Data entry and storage: Enter collected data into a structured database/spreadsheet for further processing.
Results that can be checked through processing:
- Total number of accounts held by residents of city ABC in Bank XYZ — indicates the bank's reach.
- Average number of accounts per family — indicates how many families prefer Bank XYZ.
- Average monthly balance across all account holders — indicates the financial engagement of customers.
- Market share: Compare the number of Bank XYZ accounts with accounts in other banks to determine popularity.
- Mode of account type — which type of account (Savings/Current/FD) is most popular among residents.
- Growth trend: If historical data is available, compare year-on-year growth in accounts and balances.
- Locality-wise analysis: Identify which areas of city ABC have the highest concentration of Bank XYZ customers.
These results help the bank understand its popularity and plan marketing strategies accordingly.
4Identify type of data being collected/generated in the following scenarios:
a) Recording a video
b) Marking attendance by teacher
c) Writing tweets
d) Filling an application form onlineShow solution
Concept:
- Structured data: Data that is organised in a predefined format (rows and columns), easy to search and process. Example: tables in a database.
- Unstructured data: Data that does not have a predefined format or organisation. Example: images, videos, text posts.
a) Recording a video:
Type: Unstructured Data
Justification: A video is a combination of audio and visual frames. It does not follow any predefined row-column format and cannot be directly stored in a relational database table. It is multimedia data, which is unstructured.
b) Marking attendance by teacher:
Type: Structured Data
Justification: Attendance is recorded in a tabular format with predefined fields such as Student Name, Roll Number, Date, and Present/Absent status. This follows a fixed schema and is easily stored in a database or spreadsheet.
c) Writing tweets:
Type: Unstructured Data
Justification: Tweets are free-form text messages written by users. They do not follow a fixed format — the content, length, and language vary from tweet to tweet. Text data of this nature is considered unstructured (though metadata like timestamp and user ID associated with tweets can be structured).
d) Filling an application form online:
Type: Structured Data
Justification: An online application form has predefined fields such as Name, Date of Birth, Address, Email, Phone Number, etc. The data entered follows a fixed format and is stored in a database in an organised manner, making it structured data.
5Consider the temperature (in Celsius) of 7 days of a week as 34, 34, 27, 28, 27, 34, 34. Identify the appropriate statistical technique to be used to calculate the following:
a) Find the average temperature.
b) Find the temperature Range of that week.
c) Find the standard deviation of temperature.Show solution
Given data: 34, 34, 27, 28, 27, 34, 34
Number of values (n) = 7
a) Average Temperature — Technique: MEAN
Mean is the appropriate technique to find the average value.
Average temperature of the week = 31.14°C
b) Temperature Range — Technique: RANGE
Range is the appropriate technique to find the spread between the highest and lowest values.
Temperature Range of the week = 7°C
c) Standard Deviation — Technique: STANDARD DEVIATION
Standard Deviation is the appropriate technique to measure how much the temperature values deviate from the mean.
Calculate for each value:
| 34 | 2.86 | 8.18 |
| 34 | 2.86 | 8.18 |
| 27 | −4.14 | 17.14 |
| 28 | −3.14 | 9.86 |
| 27 | −4.14 | 17.14 |
| 34 | 2.86 | 8.18 |
| 34 | 2.86 | 8.18 |
Standard Deviation of temperature = 3.31°C
a) Teacher wants to compare performance in terms of division secured by students in Class XII A and Class XII B where each class strength is same.
b) Teacher has conducted five unit tests for that class in months July to November and wants to compare the class performance in these five months.
Free with a Super Tutor account
a) Which statistical technique should be used to find out the number of students whose both parents are alumni of this school?
b) How varied are the age of parents of the students of that school?
Free with a Super Tutor account
a) Which mode of data collection should be used?
b) How would you represent the skill of students as data?
Free with a Super Tutor account
Free with a Super Tutor account
a) Compare the purchase and sale price of fruit juice and biscuits.
b) Compare sales of fruit juice, biscuits and samosa.
c) Variation in sale price of fruit juices of different companies for same quantity (in ml).
Create an appropriate dataset for these items (fruit juice, biscuits, samosa) by listing their purchase price and sale price. Apply basic statistical techniques to make the comparisons.
Free with a Super Tutor account
5 more solved questions in Understanding Data
They are free with a Super Tutor account, along with practice quizzes and flashcards for this chapter. Free to start, no card needed.
Frequently Asked Questions
What are the important topics in Understanding Data for Himachal Pradesh Board Class 12 Computer Science?
Are these NCERT Solutions for Understanding Data free?
How should I revise Understanding Data for the Himachal Pradesh Board Class 12 board exam?
Sources & Official References
Content is aligned to the official syllabus. Refer to the board website for the latest curriculum.
More resources for Understanding Data
Practice Quiz
Test yourself with a quick quiz
Important Questions
Exam-style questions with answers
Revision Notes
Key points for last-minute revision
Formula Sheet
The chapter's formulas in one place
Chapter Summary
Understand the chapter at a glance
Concept Maps
See how topics connect
Study Plan
Step-by-step plan for this chapter
Flashcards
Quick-fire cards for active recall
Syllabus
What topics to cover
For serious students
Get the full Understanding Data chapter — start free.
Quizzes, flashcards, an AI doubt solver and a study plan for Himachal Pradesh Board Class 12 Computer Science. Free to start, no card needed.