Statistics — Important Questions
ICSE · Class 9 · Mathematics
41 important questions from Statistics for ICSE Class 9 Mathematics, with answers. Includes multiple choice and multiple correct questions.
Interactive on Super Tutor
Studying Statistics? Get the full interactive chapter.
Quizzes, flashcards, AI doubt-solver and a step-by-step study plan — built for important questions and more.
Free trial, no card needed.
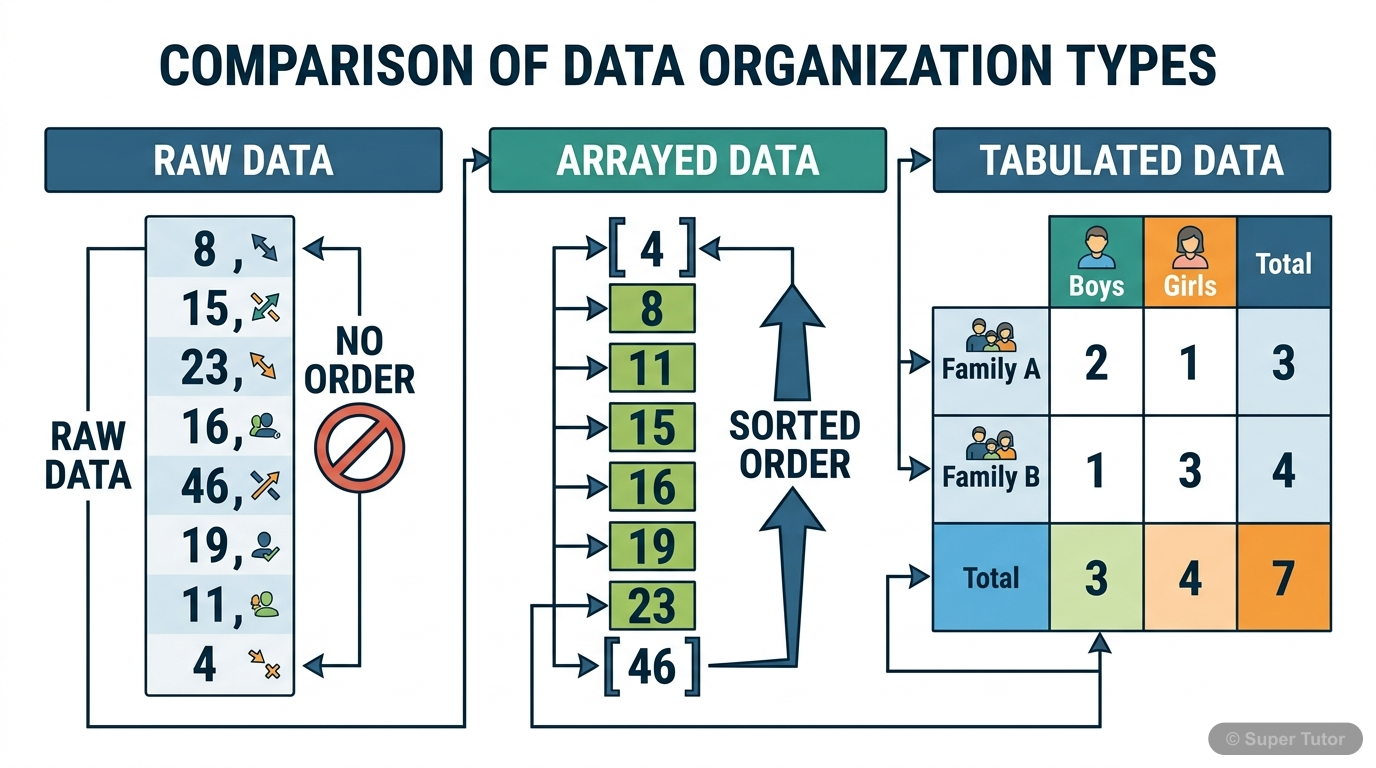
Learn better with visuals Super Tutor pairs illustrations like this with notes and quizzes for Statistics.
Important Questions from Statistics
Which of the following represent discrete variables?
Show answer
Number of students in a class, Number of books in a library, Number of cars in a parking lot
Discrete variables can only take specific whole number values and cannot be subdivided. Number of students, books, and cars are countable items. Height and weight are continuous variables as they can take any value within a range.
A frequency distribution has class intervals: 0-10, 10-20, 20-30, 30-40 with frequencies 3, 7, 5, 2 respectively. How many observations are there in total?
Show answer
17
Total observations = Sum of all frequencies = 3 + 7 + 5 + 2 = 17. Each frequency represents the count of observations in that particular class interval.
What is the class size for the class interval 45-55?
Show answer
10
Class size = Upper limit - Lower limit = 55 - 45 = 10. Class size represents the width or span of the class interval.
Which of the following are characteristics of a histogram?
Show answer
Rectangles touch each other, Used for continuous data, Height represents frequency
In a histogram, rectangles touch each other (no gaps) because it represents continuous data. The height of each rectangle represents the frequency of that class interval. Bar charts have gaps, not histograms.
+37 more questions on Statistics (ICSE Class 9 Mathematics)
Practise AllFrequently Asked Questions
What are the important topics in Statistics for ICSE Class 9 Mathematics?
How many important questions are there in Statistics?
Sources & Official References
Content is aligned to the official syllabus. Refer to the board website for the latest curriculum.
More resources for Statistics
For serious students
Get the full Statistics chapter — start free.
Quizzes, flashcards, an AI doubt solver and a study plan for ICSE Class 9 Mathematics. Free to start, no card needed.