Statistics — Chapter Summary
Tamil Nadu Board · Class 9 · Mathematics
Summary of Statistics for Tamil Nadu Board Class 9 Mathematics. Part of the Tamil Nadu Board Class 9 Mathematics syllabus.
Interactive on Super Tutor
Studying Statistics? Get the full interactive chapter.
Quizzes, flashcards, AI doubt-solver and a step-by-step study plan — built for chapter summary and more.
Free trial, no card needed.
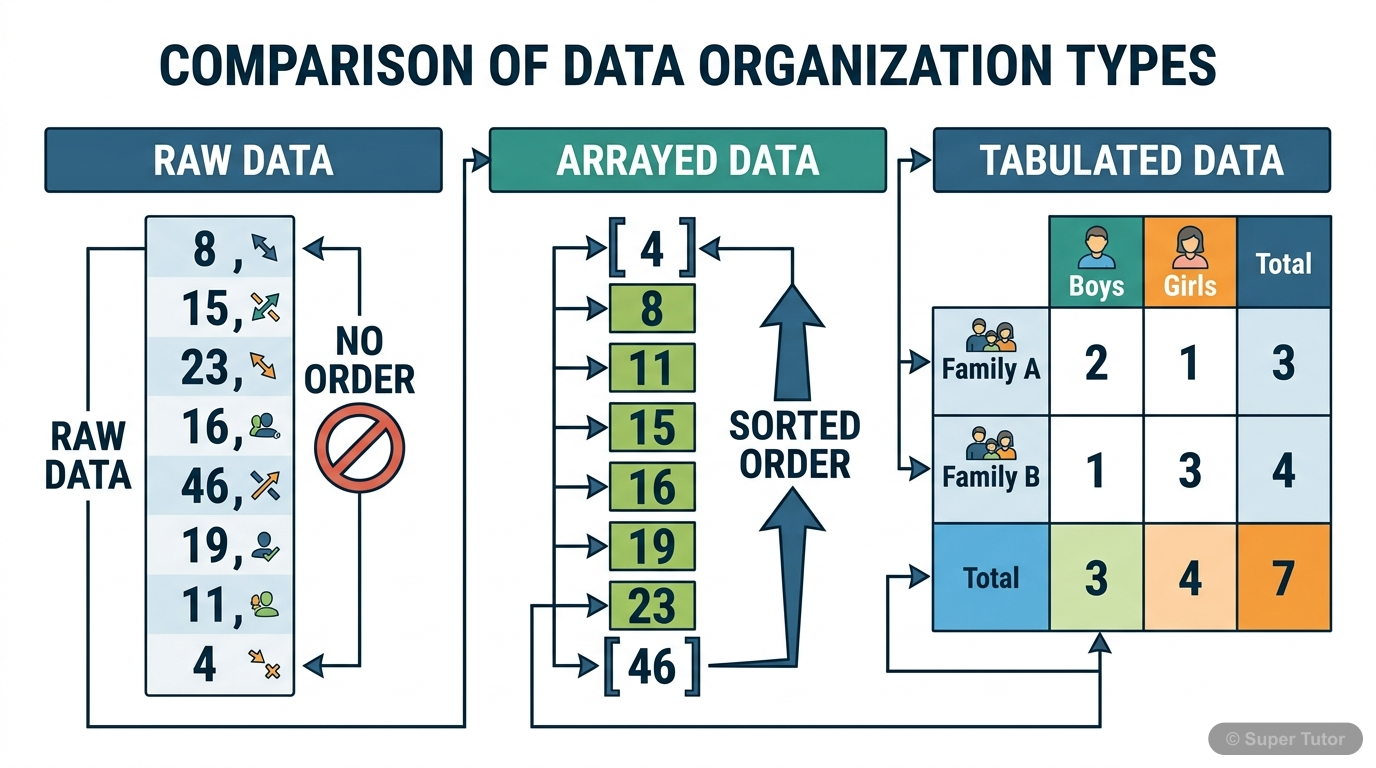
Learn better with visuals Super Tutor pairs illustrations like this with notes and quizzes for Statistics.
Overview
Statistics is the science of collecting, organising, analysing and interpreting data to make informed decisions. In our everyday life, we encounter vast amounts of numerical and non-numerical information that significantly impacts our decisions. This chapter focuses on understanding how to organize
Key Concepts
Data is collected information
Data is collected information, either numerical or qualitative. Primary data is original data collected directly by the investigator (through surveys,
Raw data becomes manageable by organizing
Raw data becomes manageable by organizing it into frequency tables. A class interval groups similar values together (e.g., 25-30, 31-35). Frequency is
The Arithmetic Mean is the most
The Arithmetic Mean is the most commonly used average, calculated by dividing the sum of all observations by the number of observations. Formula: Mean
The Median is the middle value
The Median is the middle value when data is arranged in ascending or descending order. For odd number of observations (n), Median = ((n+1)/2)th value.
The Mode is the value
The Mode is the value that appears most frequently in a dataset. For raw data, identify which number occurs the maximum times. For grouped data, use:
Learning Objectives
- Understand the concepts of primary and secondary data, and raw data
- Learn to organize ungrouped data into frequency tables using class intervals and tally marks
- Master three methods of calculating Arithmetic Mean for raw, ungrouped, and grouped data (Direct, Assumed Mean, and Step Deviation methods)
- Calculate the Median for ungrouped and grouped frequency distributions
- Find the Mode for raw, ungrouped, and grouped data
Frequently Asked Questions
What are the important topics in Statistics for Tamil Nadu Board Class 9 Mathematics?
How should I revise Statistics for Class 9 exams?
Sources & Official References
Content is aligned to the official syllabus. Refer to the board website for the latest curriculum.
More resources for Statistics
For serious students
Get the full Statistics chapter — start free.
Quizzes, flashcards, an AI doubt solver and a study plan for Tamil Nadu Board Class 9 Mathematics. Free to start, no card needed.