Statistics — Flashcards
Tamil Nadu Board · Class 9 · Mathematics
25 flashcards for Statistics (Tamil Nadu Board Class 9 Mathematics) to test yourself on key terms and facts. Sample: "Given raw data of marks obtained by.
Interactive on Super Tutor
Studying Statistics? Get the full interactive chapter.
Quizzes, flashcards, AI doubt-solver and a step-by-step study plan — built for flashcards and more.
Free trial, no card needed.
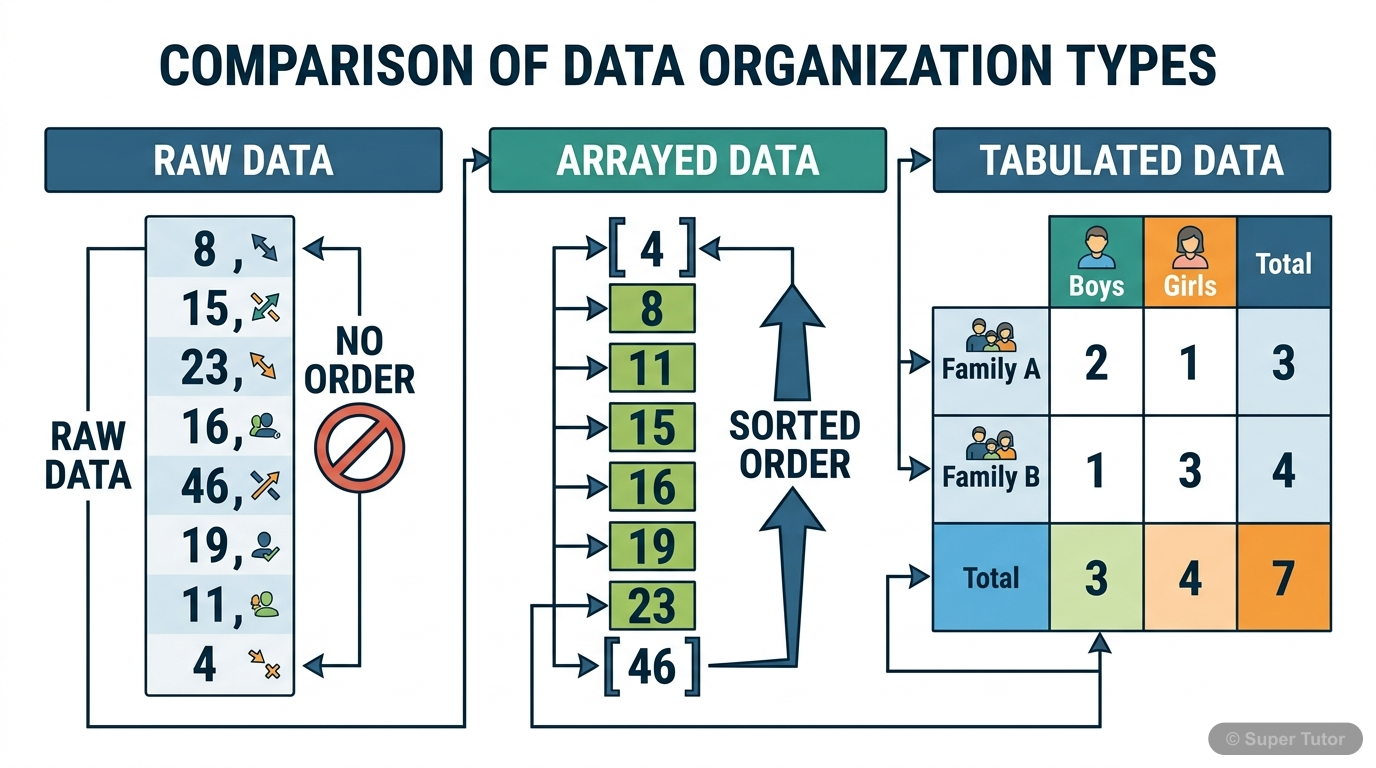
Learn better with visuals Super Tutor pairs illustrations like this with notes and quizzes for Statistics.
Given raw data of marks obtained by 8 students: 45, 52, 38, 52, 60, 52, 48, 55. Calculate the arithmetic mean.
Answer
Step 1: Add all the marks 45 + 52 + 38 + 52 + 60 + 52 + 48 + 55 = 402 Step 2: Count the number of students n = 8 Step 3: Apply the formula: Mean = Σx / n Mean = 402 / 8 = 50.25 Answer: The arithmet…
A cricketer scored 25, 32, 36, 38, 45, 41, 35, 36 in eight T20 matches. Use the Assumed Mean Method with assumed mean = 36 to find the average score.
Answer
Step 1: Choose assumed mean A = 36 Step 2: Calculate deviation (d) for each score: 25-36 = -11, 32-36 = -4, 36-36 = 0, 38-36 = 2 45-36 = 9, 41-36 = 5, 35-36 = -1, 36-36 = 0 Step 3: Find the average …
When do you use the Assumed Mean Method instead of the direct method for calculating arithmetic mean?
Answer
Use the Assumed Mean Method when: 1. The numbers are large and numerous (makes calculation easier and reduces errors) 2. You want to save time in computation 3. Direct multiplication of large numbers …
Find the arithmetic mean of the following frequency distribution: Height (cm): 140, 142, 150, 148, 145, 147 Frequency: 4, 1, 2, 1, 2, 2
Answer
Step 1: Create a table with fx values Height(x) | Frequency(f) | fx 140 | 4 | 560 142 | 1 | 142 150 | 2 | 300 148 | 1 | 148 145 …
Calculate the mean age of residents using the Direct Method: Age: 0-10, 10-20, 20-30, 30-40, 40-50, 50-60 No. of Residents: 2, 6, 9, 7, 4, 2
Answer
Step 1: Find the midpoint (x) of each class interval Midpoint = (Lower limit + Upper limit) / 2 Age | No. of Residents(f) | Midvalue(x) | fx 0-10 | 2 | 5 | 10 10-20 | 6 …
Calculate the mean using the Assumed Mean Method for this grouped data: Class Interval: 100-120, 120-140, 140-160, 160-180, 180-200, 200-220, 220-240 Frequency: 10, 8, 4, 4, 3, 1, 2
Answer
Step 1: Choose assumed mean A = 170 (middle value) Step 2: Calculate deviation d = x - A and fd Class | f | x | d=x-170 | fd 100-120 | 10 | 110 | -60 | -600 120-140 | 8 | 130 | -40 | -…
Find the mean using Step Deviation Method: Class: 0-8, 8-16, 16-24, 24-32, 32-40, 40-48 Frequency: 10, 20, 14, 16, 18, 22
Answer
Step 1: Identify A = 28 (assumed mean) and c = 8 (class width) Step 2: Calculate d = (x-A)/c and fd Class | f | x | d=(x-28)/8 | fd 0-8 | 10 | 4 | -3 | -30 8-16 | 20 | 12 | -2 …
What is the special property of arithmetic mean? If the mean of marks is 22 for observations 21, 30, 22, 16, 24, 28, 18, 17, verify this property.
Answer
Special Property: The sum of deviations of all entries from the arithmetic mean is always ZERO. Mathematically: Σ(xᵢ - Mean) = 0 Verification: Mean = (21+30+22+16+24+28+18+17)/8 = 176/8 = 22 Deviati…
+17 more flashcards
Practise AllFrequently Asked Questions
What are the important topics in Statistics for Tamil Nadu Board Class 9 Mathematics?
How many flashcards are available for Statistics?
How should I revise Statistics for Class 9 exams?
Sources & Official References
Content is aligned to the official syllabus. Refer to the board website for the latest curriculum.
More resources for Statistics
Practice Quiz
Test yourself with a quick quiz
Important Questions
Exam-style questions with answers
Revision Notes
Key points for last-minute revision
Formula Sheet
The chapter's formulas in one place
Chapter Summary
Understand the chapter at a glance
Concept Maps
See how topics connect
Syllabus
What topics to cover
For serious students
Get the full Statistics chapter — start free.
Quizzes, flashcards, an AI doubt solver and a study plan for Tamil Nadu Board Class 9 Mathematics. Free to start, no card needed.