Demographic Attributes — Concept Maps
ICSE · Class 12 · Geography
4 concept maps of Demographic Attributes for ICSE Class 12 Geography, each also written out as a text outline. Covers Occupation Classification.
Interactive on Super Tutor
Studying Demographic Attributes? Get the full interactive chapter.
Quizzes, flashcards, AI doubt-solver and a step-by-step study plan — built for concept maps and more.
Free trial, no card needed.
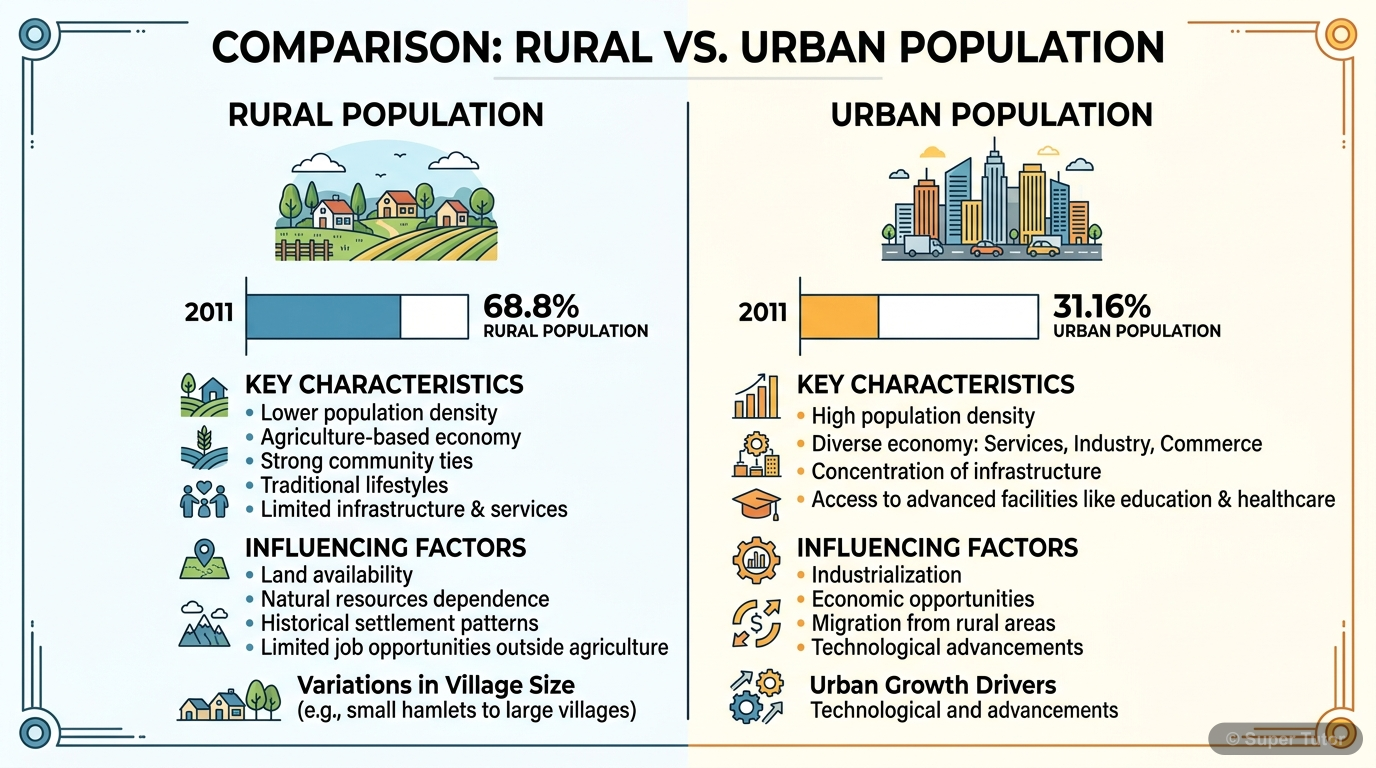
Learn better with visuals Super Tutor pairs illustrations like this with notes and quizzes for Demographic Attributes.
Chapter Overview – Demographic Attributes
The map in words
- Demographic Attributes
- Rural-Urban Population
- Rural 68.84 percent
- Most rural HP 89.96 percent
- UP largest absolute rural pop
- Urban 31.16 percent
- 377 million in 2011
- Goa most urbanised state
- Delhi most urbanised UT
- Urbanisation Process
- Rural to urban transformation
- Increasing since 1901
- Rural 68.84 percent
- Sex Composition
- Sex Ratio Definition
- Females per 1000 males
- National Average 940 in 2011
- Highest Kerala 1084
- Lowest Daman and Diu 618
- Causes of Low Sex Ratio
- Female foeticide
- Dowry deaths
- Male preference
- Migration effects
- Sex Ratio Definition
- Age Composition
- Young 0-14 yrs 30.76 percent
- Adult 15-59 yrs 60 percent
- Working age group
- Demographic Dividend
- Old 60 plus yrs 8.58 percent
- Age-Sex Pyramid
- 2020 young bulge
- 2050 adult bulge
- 2100 old age bulge
- Literacy
- Effective Literacy Rate 74.04 percent 2011
- Male 82.14 percent
- Female 65.46 percent
- Highest Kerala 93.91 percent
- Lowest Bihar 63.82 percent
- Literacy Decade 1991-2001
- Effective Literacy Rate 74.04 percent 2011
- Working Population
- Participation Rate 39.8 percent
- Male 51.7 percent
- Female 25.60 percent
- Main Worker 6 months or more
- Marginal Worker less than 6 months
- Occupational Categories
- Cultivators 24.6 percent
- Agri Labourers 30 percent
- HH Industries 3.8 percent
- Other Workers 41.6 percent
- Participation Rate 39.8 percent
- Rural-Urban Population
Demographic Attributes Overview
The map in words
- Demographic Attributes
- Rural-Urban Distribution
- Rural Population
- Villages
- Agriculture
- Close social ties
- Urban Population
- Cities and towns
- Industry and services
- Formal relations
- Regional Variations
- Highest rural: Himachal Pradesh 89.96%
- Highest urban: Goa 62.17%
- Rural Population
- Sex Composition
- Definition
- Females per 1000 males
- India: 940 in 2011
- Favorable Regions
- Kerala 1084
- Puducherry 1038
- Low Sex Ratio
- Gender discrimination
- Dowry deaths
- Female feticide
- Delhi 866
- Definition
- Age Composition
- Young 0-14 years
- 30.76 percent
- Dependent
- Working 15-59 years
- Over 60 percent
- Economically active
- Elderly 60+ years
- 8.58 percent
- Dependent
- Young 0-14 years
- Literacy
- Definition
- Read write ability
- Age 7 years and above
- Trends
- 1901: 5.35%
- 2011: 74.04%
- Regional Gaps
- Kerala: 93.91%
- Bihar: 63.82%
- Definition
- Working Population
- Main Workers
- 6 months or more
- Regular employment
- Marginal Workers
- Less than 6 months
- Seasonal work
- Occupations
- Cultivators 24.6%
- Agricultural labourers 30%
- Others 45.4%
- Main Workers
- Rural-Urban Distribution
Demographic Attributes of India — Complete Overview
The map in words
- Demographic Attributes
- Rural-Urban Population
- Rural 68.84 percent
- Highest HP 89.96 percent
- Lowest Delhi 2.50 percent
- Urban 31.16 percent
- 377.11 million in 2011
- Goa most urbanised 62.17 percent
- Urbanisation
- Society shifts rural to urban
- Non-agri activities increase
- Rural 68.84 percent
- Sex Ratio
- Females per 1000 males
- India 940 in 2011
- Kerala highest 1084
- Daman and Diu lowest 618
- Causes of low ratio
- Son preference
- Female foeticide
- Maternal mortality
- Dowry deaths
- Age Composition
- Young 0 to 14 years
- 30.76 percent of population
- Adult 15 to 59 years
- 60 percent working age
- Old 60 plus years
- 8.58 percent
- Age Sex Pyramid
- 2020 young bulge
- 2050 adult bulge
- 2100 elderly bulge
- Young 0 to 14 years
- Literacy Rate
- Crude literacy 64.32 percent
- Effective literacy 74.04 percent
- Male 82.14 percent
- Female 65.46 percent
- Kerala highest 93.91 percent
- Bihar lowest 63.82 percent
- Literacy Decade 1991 to 2001
- Working Population
- Participation rate 39.8 percent
- Male 51.7 percent
- Female 25.6 percent
- Four categories
- Cultivators 24.6 percent
- Agri Labourers 30 percent
- HH Industries 3.8 percent
- Other Workers 41.6 percent
- Participation rate 39.8 percent
- Rural-Urban Population
Population composition and its demographic attributes
The map in words
- Population composition and its demographic attributes
- Rural-Urban Population
- Sex Composition
- Age Composition
- Literacy
- Working Population
- Occupation
- Demographic significance
Explore these maps interactively
Explore DiagramsFrequently Asked Questions
What are the important topics in Demographic Attributes for ICSE Class 12 Geography?
What do the concept maps for Demographic Attributes show?
How should I revise Demographic Attributes for the ICSE Class 12 board exam?
Sources & Official References
Content is aligned to the official syllabus. Refer to the board website for the latest curriculum.
More resources for Demographic Attributes
Practice Quiz
Test yourself with a quick quiz
Important Questions
Exam-style questions with answers
Revision Notes
Key points for last-minute revision
Chapter Summary
Understand the chapter at a glance
Study Plan
Step-by-step plan for this chapter
Flashcards
Quick-fire cards for active recall
Syllabus
What topics to cover
For serious students
Get the full Demographic Attributes chapter — start free.
Quizzes, flashcards, an AI doubt solver and a study plan for ICSE Class 12 Geography. Free to start, no card needed.