Statistics and Probability — Chapter Summary
Tamil Nadu Board · Class 10 · Mathematics
Summary of Statistics and Probability for Tamil Nadu Board Class 10 Mathematics. Part of the Tamil Nadu Board Class 10 Mathematics syllabus.
Interactive on Super Tutor
Studying Statistics and Probability? Get the full interactive chapter.
Quizzes, flashcards, AI doubt-solver and a step-by-step study plan — built for chapter summary and more.
Free trial, no card needed.
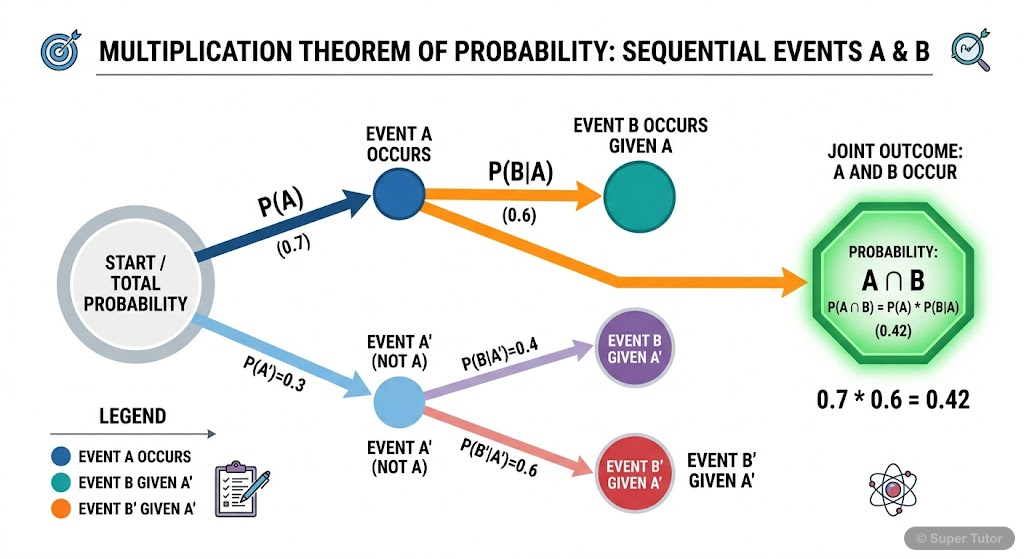
Learn better with visuals Super Tutor pairs illustrations like this with notes and quizzes for Statistics and Probability.
Overview
Statistics and Probability form the foundation of data analysis and decision-making in the modern world. This chapter explores how to collect, organize, and interpret data using measures of central tendency and dispersion, and introduces the fundamental concepts of probability theory. From understan
Key Concepts
These are single values that represent
These are single values that represent the entire dataset. The arithmetic mean (average) is calculated by dividing the sum of all observations by the
Range is the simplest measure
Range is the simplest measure of dispersion, calculated as R = L - S (largest minus smallest value). However, range only considers extreme values and
Variance (σ²) is the mean
Variance (σ²) is the mean of squared deviations from the mean: σ² = Σ(xᵢ - x̄)²/n. Standard deviation (σ) is the positive square root of variance: σ =
CV = (σ/x̄) × 100%
CV = (σ/x̄) × 100%, a relative measure of dispersion expressed as a percentage. It allows comparison of two datasets with different units or different
A random experiment is a process
A random experiment is a process with known possible outcomes but unknown actual outcome. Examples: tossing a coin, rolling a die. The sample space (S
Learning Objectives
- Understand and calculate measures of central tendency (mean, median, mode) for ungrouped and grouped data
- Comprehend the concept of dispersion and calculate range, standard deviation, variance, and coefficient of variation
- Apply the properties of standard deviation and understand how data transformations affect it
- Define and work with random experiments, sample spaces, and tree diagrams
- Classify different types of events (equally likely, certain, impossible, mutually exclusive, exhaustive, complementary)
Frequently Asked Questions
What are the important topics in Statistics and Probability for Tamil Nadu Board Class 10 Mathematics?
How should I revise Statistics and Probability for the Tamil Nadu Board Class 10 board exam?
Sources & Official References
Content is aligned to the official syllabus. Refer to the board website for the latest curriculum.
More resources for Statistics and Probability
For serious students
Get the full Statistics and Probability chapter — start free.
Quizzes, flashcards, an AI doubt solver and a study plan for Tamil Nadu Board Class 10 Mathematics. Free to start, no card needed.