Statistics and Probability — Flashcards
Tamil Nadu Board · Class 10 · Mathematics
24 flashcards for Statistics and Probability (Tamil Nadu Board Class 10 Mathematics) to test yourself on key terms and facts.
Interactive on Super Tutor
Studying Statistics and Probability? Get the full interactive chapter.
Quizzes, flashcards, AI doubt-solver and a step-by-step study plan — built for flashcards and more.
Free trial, no card needed.
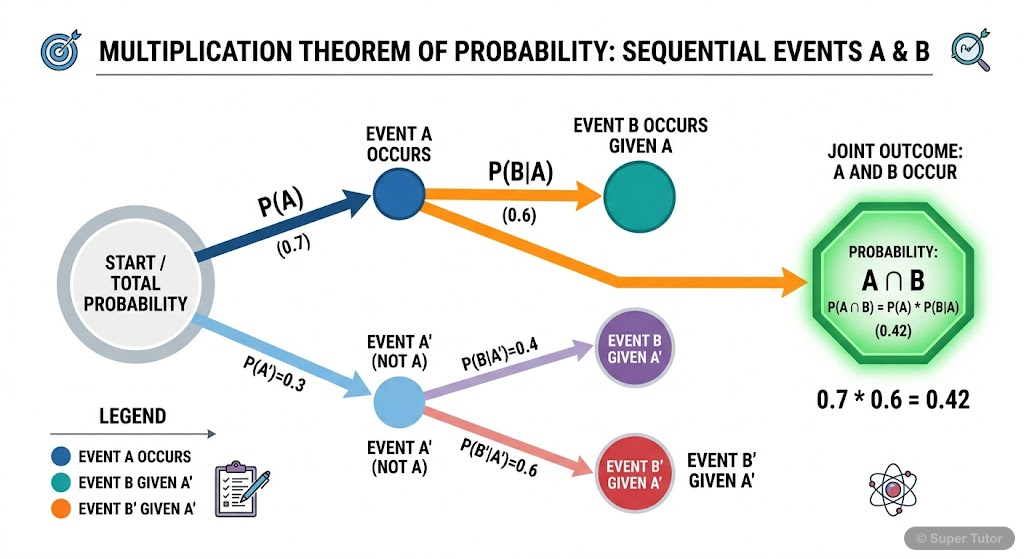
Learn better with visuals Super Tutor pairs illustrations like this with notes and quizzes for Statistics and Probability.
Calculate the mean of the following data: 25, 30, 35, 40, 45
Answer
Step 1: Add all observations = 25 + 30 + 35 + 40 + 45 = 175 Step 2: Count the number of observations = 5 Step 3: Apply formula: Mean = Sum/n = 175/5 = 35 Answer: The mean is 35…
Find the range and coefficient of range from the data: 12, 45, 23, 67, 18, 39
Answer
Step 1: Identify largest value (L) = 67 and smallest value (S) = 12 Step 2: Calculate Range = L - S = 67 - 12 = 55 Step 3: Calculate Coefficient of Range = (L - S)/(L + S) = 55/(67 + 12) = 55/79 ≈ 0.6…
When do you use the standard deviation formula: σ = √[Σx²/n - (Σx/n)²]?
Answer
Use this 'direct method' formula when: 1. You have ungrouped data given directly as individual values 2. You need to find how spread out the values are from the mean 3. Calculating squared deviations …
The standard deviation of TV watching hours is: 6, 7, 8, 9, 10, 11, 12 with frequencies 3, 6, 9, 13, 8, 5, 4. Calculate the mean.
Answer
Step 1: Create table with xᵢ and fᵢ values Step 2: Calculate xᵢfᵢ for each: 18, 42, 72, 117, 80, 55, 48 Step 3: Sum xᵢfᵢ = 432 and sum fᵢ = 48 Step 4: Apply Mean formula = Σxᵢfᵢ/N = 432/48 = 9 Answer:…
Find the standard deviation of grouped data: Classes 0-10, 10-20, 20-30, 30-40 with frequencies 8, 12, 17, 14 (Assume mean = 20.5)
Answer
Step 1: Find class midpoints: 5, 15, 25, 35 Step 2: Calculate deviations from mean: dᵢ = xᵢ - 20.5 = -15.5, -5.5, 4.5, 14.5 Step 3: Calculate fᵢdᵢ²: 8(240.25) = 1922, 12(30.25) = 363, 17(20.25) = 344.
When the original data is 2, 3, 5, 7, 8 with σ = 2.28, what happens to standard deviation when you multiply each value by 4?
Answer
When you multiply all data values by a constant k, the standard deviation also gets multiplied by k. Original data: 2, 3, 5, 7, 8, σ₁ = 2.28 New data: 8, 12, 20, 28, 32 (multiplied by 4) New σ₂ = 4 ×…
Calculate the variance of the first 5 natural numbers: 1, 2, 3, 4, 5
Answer
Step 1: Calculate mean = (1+2+3+4+5)/5 = 15/5 = 3 Step 2: Find deviations from mean and square them: (1-3)² = 4, (2-3)² = 1, (3-3)² = 0, (4-3)² = 1, (5-3)² = 4 Step 3: Sum of squared deviations = 4 + …
Mean = 25.6, Coefficient of Variation = 18.75%. Find the standard deviation.
Answer
Use the coefficient of variation formula: C.V. = (σ/mean) × 100% Step 1: Substitute known values 18.75 = (σ/25.6) × 100 Step 2: Rearrange to find σ σ = (18.75 × 25.6)/100 σ = 480/100 σ = 4.8 Answer…
+16 more flashcards
Practise AllFrequently Asked Questions
What are the important topics in Statistics and Probability for Tamil Nadu Board Class 10 Mathematics?
How many flashcards are available for Statistics and Probability?
How should I revise Statistics and Probability for the Tamil Nadu Board Class 10 board exam?
Sources & Official References
Content is aligned to the official syllabus. Refer to the board website for the latest curriculum.
More resources for Statistics and Probability
Practice Quiz
Test yourself with a quick quiz
Important Questions
Exam-style questions with answers
Revision Notes
Key points for last-minute revision
Formula Sheet
The chapter's formulas in one place
Chapter Summary
Understand the chapter at a glance
Concept Maps
See how topics connect
Syllabus
What topics to cover
For serious students
Get the full Statistics and Probability chapter — start free.
Quizzes, flashcards, an AI doubt solver and a study plan for Tamil Nadu Board Class 10 Mathematics. Free to start, no card needed.