Data And Their Representations — Concept Maps
NIOS · Class 10 · Maths
4 concept maps of Data And Their Representations for NIOS Class 10 Maths, each also written out as a text outline.
Interactive on Super Tutor
Studying Data And Their Representations? Get the full interactive chapter.
Quizzes, flashcards, AI doubt-solver and a step-by-step study plan — built for concept maps and more.
Free trial, no card needed.
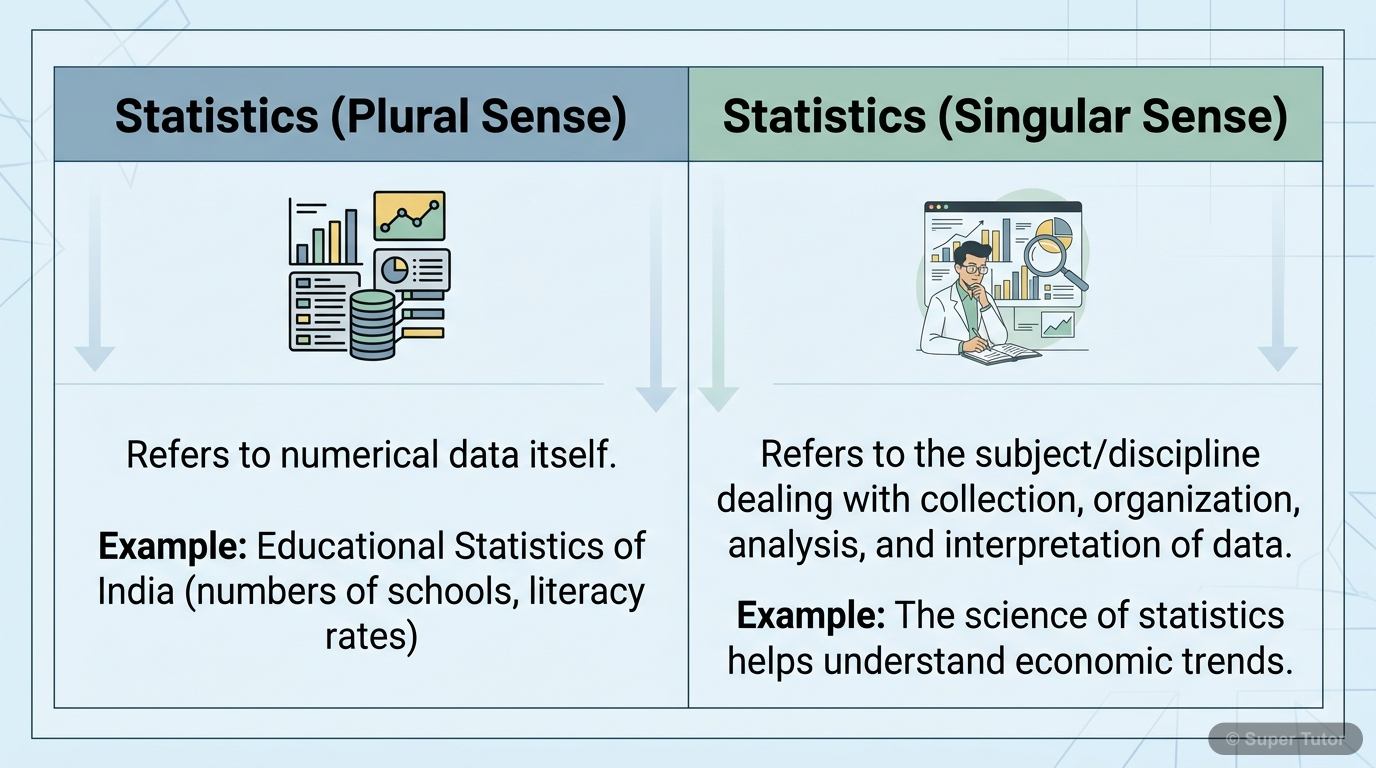
One of 11 illustrations for Data And Their Representations in Super Tutor — alongside flashcards, concept maps and practice questions.
Data and Their Representations Overview
The map in words
- Data and Representations
- Data Types
- Primary Data
- Self Collected
- Direct Survey
- Secondary Data
- Published Reports
- Government Records
- Primary Data
- Organization Methods
- Raw Data
- Arrayed Data
- Frequency Tables
- Ungrouped
- Grouped
- Cumulative Frequency
- Graphical Representation
- Bar Graphs
- Categorical Data
- Equal Spacing
- Histograms
- Continuous Data
- No Gaps
- Frequency Polygons
- Smooth Curves
- Class Marks
- Bar Graphs
- Data Types
Statistics and Data Representations - Complete Overview
The map in words
- Statistics
- Data Types
- Primary Data
- Direct Collection
- Own Methods
- Secondary Data
- Published Sources
- External Reports
- Primary Data
- Data Organization
- Raw Data
- Unorganized Form
- Arrayed Data
- Ordered Form
- Range Calculation
- Max minus Min
- Raw Data
- Frequency Distribution
- Ungrouped
- Individual Values
- Direct Frequencies
- Grouped
- Class Intervals
- Class Marks
- Class Limits
- Cumulative Frequency
- Ungrouped
- Graphical Representation
- Bar Graphs
- Gaps Between Bars
- Discrete Data
- Histograms
- No Gaps
- Continuous Data
- Area Proportional
- Frequency Polygons
- Join Midpoints
- Smooth Curves
- Bar Graphs
- Data Types
Complete Overview of Data and Their Representations
The map in words
- Data and Representations
- Types of Data
- Primary Data
- Self collected
- Direct surveys
- Secondary Data
- Published reports
- Government records
- Primary Data
- Data Organization
- Raw Data
- Original form
- Unprocessed
- Arrayed Data
- Ascending order
- Descending order
- Range calculation
- Maximum minus Minimum
- Raw Data
- Frequency Tables
- Ungrouped
- Each value listed
- Individual frequencies
- Grouped
- Class intervals
- Class limits
- Class size
- Cumulative
- Running totals
- Less than values
- Ungrouped
- Graphical Representation
- Bar Graphs
- Discrete data
- Equal spacing
- Different categories
- Histograms
- Continuous data
- No spacing
- Class intervals
- Frequency Polygons
- Join midpoints
- Class marks
- Smooth curves
- Bar Graphs
- Types of Data
Statistics and the representation of numerical data
The map in words
- Statistics and the representation of numerical data
- Statistics
- Collection of data
- Presentation of data
- Frequency distributions
- Cumulative frequency
- Graphical representation
- Measures and terms
Explore these maps interactively
Explore DiagramsFrequently Asked Questions
What are the important topics in Data And Their Representations for NIOS Class 10 Maths?
What do the concept maps for Data And Their Representations show?
How should I revise Data And Their Representations for the NIOS Class 10 board exam?
Sources & Official References
Content is aligned to the official syllabus. Refer to the board website for the latest curriculum.
More resources for Data And Their Representations
Practice Quiz
Test yourself with a quick quiz
Important Questions
Exam-style questions with answers
Revision Notes
Key points for last-minute revision
Formula Sheet
The chapter's formulas in one place
Chapter Summary
Understand the chapter at a glance
Study Plan
Step-by-step plan for this chapter
Flashcards
Quick-fire cards for active recall
Syllabus
What topics to cover
For serious students
Get the full Data And Their Representations chapter — start free.
Quizzes, flashcards, an AI doubt solver and a study plan for NIOS Class 10 Maths. Free to start, no card needed.