Data And Their Representations — Important Questions
NIOS · Class 10 · Maths
40 important questions from Data And Their Representations for NIOS Class 10 Maths, with answers. Includes multiple choice and numerical questions.
Interactive on Super Tutor
Studying Data And Their Representations? Get the full interactive chapter.
Quizzes, flashcards, AI doubt-solver and a step-by-step study plan — built for important questions and more.
Free trial, no card needed.
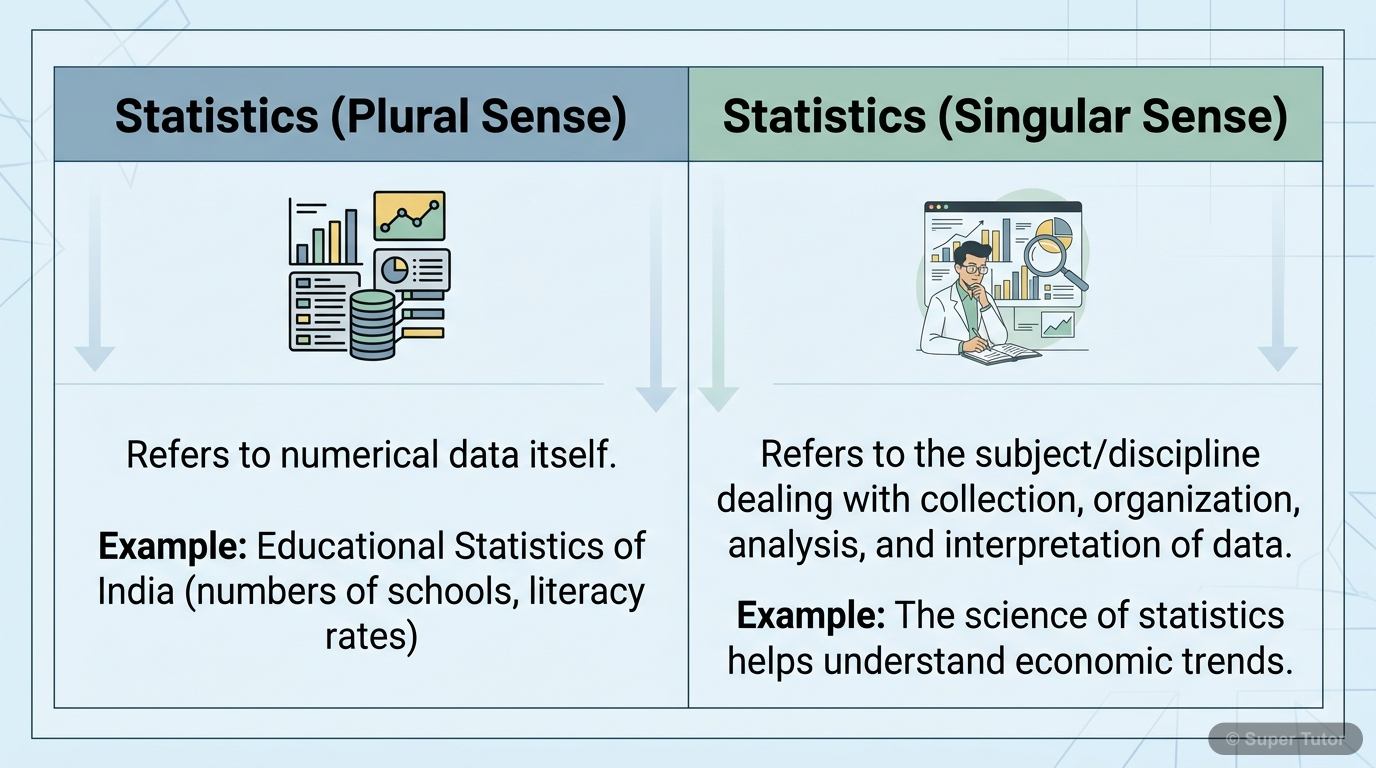
One of 11 illustrations for Data And Their Representations in Super Tutor — alongside flashcards, concept maps and practice questions.
Important Questions from Data And Their Representations
In a frequency table, if the first three cumulative frequencies are 5, 12, 20, what is the frequency of the third class?
Show answer
8
Step 1: Frequency of a class = Cumulative frequency of that class - Cumulative frequency of previous class. Step 2: Given cumulative frequencies: 1st = 5, 2nd = 12, 3rd = 20. Step 3: Frequency of 3rd class = 20 - 12 = 8. Step 4: Therefore, the frequency of the third class is 8.
If a class interval is 40-50 and the class size is 10, what would be the next class interval?
Show answer
50-60
Step 1: In continuous class intervals, the upper limit of one class becomes the lower limit of the next class. Step 2: Given class: 40-50 with class size 10. Step 3: Next class starts from 50 (upper limit of current class). Step 4: With class size 10, next class = 50-60.
A histogram shows frequencies 5, 8, 12, 9, 6 for five classes. What is the total frequency?
Show answer
40
Step 1: Total frequency = Sum of all individual frequencies. Step 2: Given frequencies: 5, 8, 12, 9, 6. Step 3: Total frequency = 5 + 8 + 12 + 9 + 6 = 40. Step 4: Therefore, the total frequency is 40.
In a bar graph showing favorite sports, Cricket has 15 votes, Football has 12 votes, and Tennis has 8 votes. How many more votes does Cricket have than Tennis?
Show answer
7
Step 1: Find the difference between Cricket and Tennis votes. Step 2: Cricket votes = 15, Tennis votes = 8. Step 3: Difference = 15 - 8 = 7. Step 4: Therefore, Cricket has 7 more votes than Tennis.
+36 more questions on Data And Their Representations (NIOS Class 10 Maths)
Practise AllFrequently Asked Questions
What are the important topics in Data And Their Representations for NIOS Class 10 Maths?
How many important questions are there in Data And Their Representations?
Sources & Official References
Content is aligned to the official syllabus. Refer to the board website for the latest curriculum.
More resources for Data And Their Representations
Practice Quiz
Test yourself with a quick quiz
Revision Notes
Key points for last-minute revision
Formula Sheet
The chapter's formulas in one place
Chapter Summary
Understand the chapter at a glance
Concept Maps
See how topics connect
Study Plan
Step-by-step plan for this chapter
Flashcards
Quick-fire cards for active recall
Syllabus
What topics to cover
For serious students
Get the full Data And Their Representations chapter — start free.
Quizzes, flashcards, an AI doubt solver and a study plan for NIOS Class 10 Maths. Free to start, no card needed.