Data And Their Representations — Flashcards
NIOS · Class 10 · Maths
28 flashcards for Data And Their Representations (NIOS Class 10 Maths) to test yourself on key terms and facts. Part of the NIOS Class 10 Maths syllabus.
Interactive on Super Tutor
Studying Data And Their Representations? Get the full interactive chapter.
Quizzes, flashcards, AI doubt-solver and a step-by-step study plan — built for flashcards and more.
Free trial, no card needed.
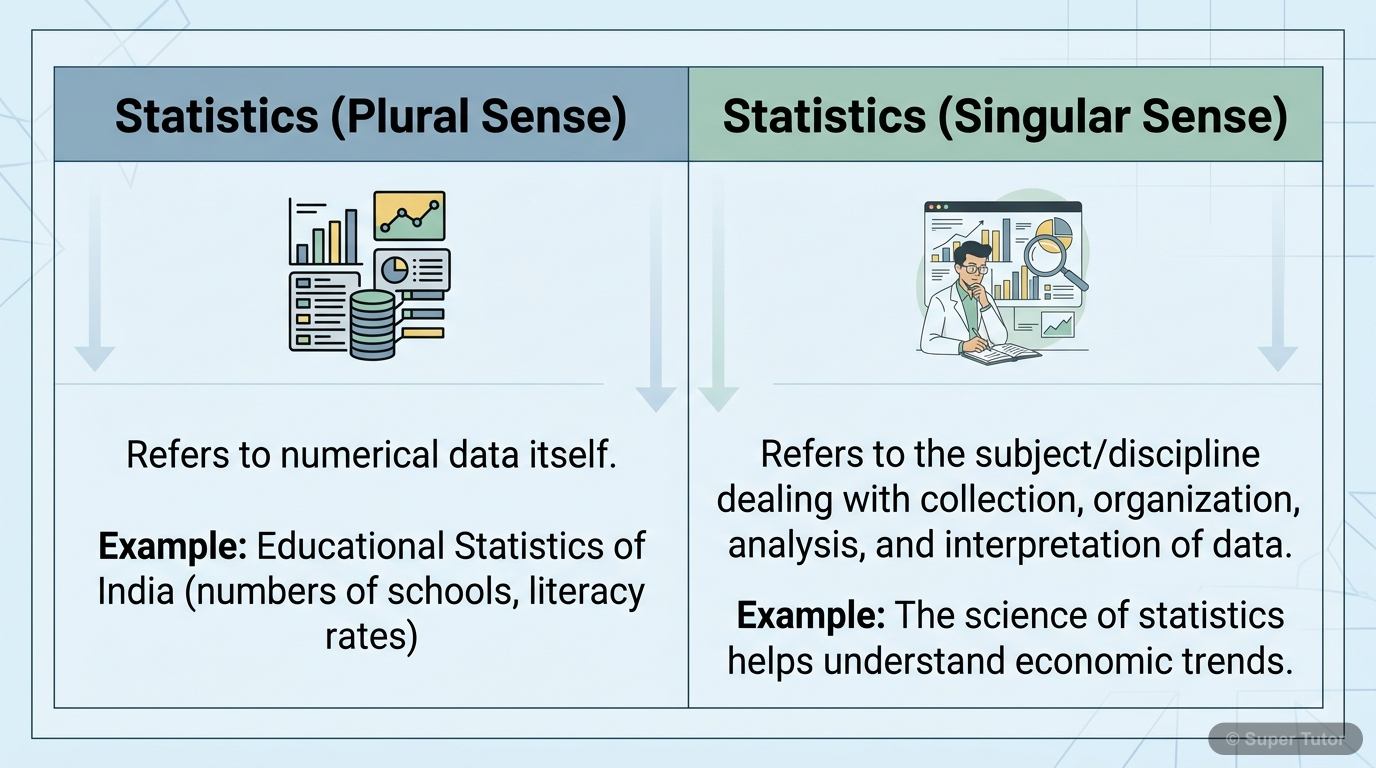
One of 11 illustrations for Data And Their Representations in Super Tutor — alongside flashcards, concept maps and practice questions.
Raw data of 20 students' marks is: 45, 56, 61, 56, 31, 33, 70, 61, 76, 56, 36, 59, 64, 56, 88, 28, 56, 70, 64, 74. Find the range.
Answer
Step 1: Maximum value = 88 Step 2: Minimum value = 28 Step 3: Range = Maximum - Minimum = 88 - 28 = 60 Answer: 60…
How is class mark found for a class interval? Find the class mark of 35-41.
Answer
Formula: Class mark = (Lower limit + Upper limit)/2 Step 1: Lower limit = 35, upper limit = 41 Step 2: Class mark = (35 + 41)/2 = 76/2 = 38 Answer: 38…
Why are tally marks written in bunches of five?
Answer
Tally marks make counting large data easier. Step 1: Each new observation gets one mark. Step 2: The fifth mark crosses the first four diagonally. Step 3: This creates easy groups of 5 for quick count…
A data set has maximum value 205 and minimum value 105. Find the range.
Answer
Step 1: Maximum value = 205 Step 2: Minimum value = 105 Step 3: Range = 205 - 105 = 100 Answer: 100…
Data are: 28, 31, 33, 36, 45, 56, 56, 56, 56, 56, 59, 61, 61, 64, 64, 70, 70, 74, 76, 88. Find the number of students scoring 56 and the number scoring more than 60.
Answer
Step 1: Count 56 in the list = 5 Step 2: Count values more than 60: 61, 61, 64, 64, 70, 70, 74, 76, 88 Step 3: Number more than 60 = 9 Answer: 56 occurs 5 times, and 9 values are more than 60.
Classify the data: voters' lists, data collected in a census-questionnaire, and absentee data collected from school records.
Answer
Step 1: Voters' lists are collected directly by the investigator, so they are primary data. Step 2: Data collected in a census-questionnaire are collected directly, so they are primary data. Step 3: A…
Why can the same data be primary for one user and secondary for another?
Answer
Data depends on who collected it. Step 1: If an investigator collects data directly, it is primary data for that investigator. Step 2: If another person later uses the same data, it becomes secondary …
Construct the range of the marks data of 20 students: 45, 56, 61, 56, 31, 33, 70, 61, 76, 56, 36, 59, 64, 56, 88, 28, 56, 70, 64, 74.
Answer
Step 1: Arrange mentally to identify extremes. Step 2: Highest mark = 88 Step 3: Lowest mark = 28 Step 4: Range = 88 - 28 = 60 Answer: 60…
+20 more flashcards
Practise AllFrequently Asked Questions
What are the important topics in Data And Their Representations for NIOS Class 10 Maths?
How many flashcards are available for Data And Their Representations?
How should I revise Data And Their Representations for the NIOS Class 10 board exam?
Sources & Official References
Content is aligned to the official syllabus. Refer to the board website for the latest curriculum.
More resources for Data And Their Representations
Practice Quiz
Test yourself with a quick quiz
Important Questions
Exam-style questions with answers
Revision Notes
Key points for last-minute revision
Formula Sheet
The chapter's formulas in one place
Chapter Summary
Understand the chapter at a glance
Concept Maps
See how topics connect
Study Plan
Step-by-step plan for this chapter
Syllabus
What topics to cover
For serious students
Get the full Data And Their Representations chapter — start free.
Quizzes, flashcards, an AI doubt solver and a study plan for NIOS Class 10 Maths. Free to start, no card needed.