Statistics — Flashcards
Madhya Pradesh Board · Class 10 · Mathematics
56 flashcards for Statistics (Madhya Pradesh Board Class 10 Mathematics) to test yourself on key terms and facts.
Interactive on Super Tutor
Studying Statistics? Get the full interactive chapter.
Quizzes, flashcards, AI doubt-solver and a step-by-step study plan — built for flashcards and more.
Free trial, no card needed.
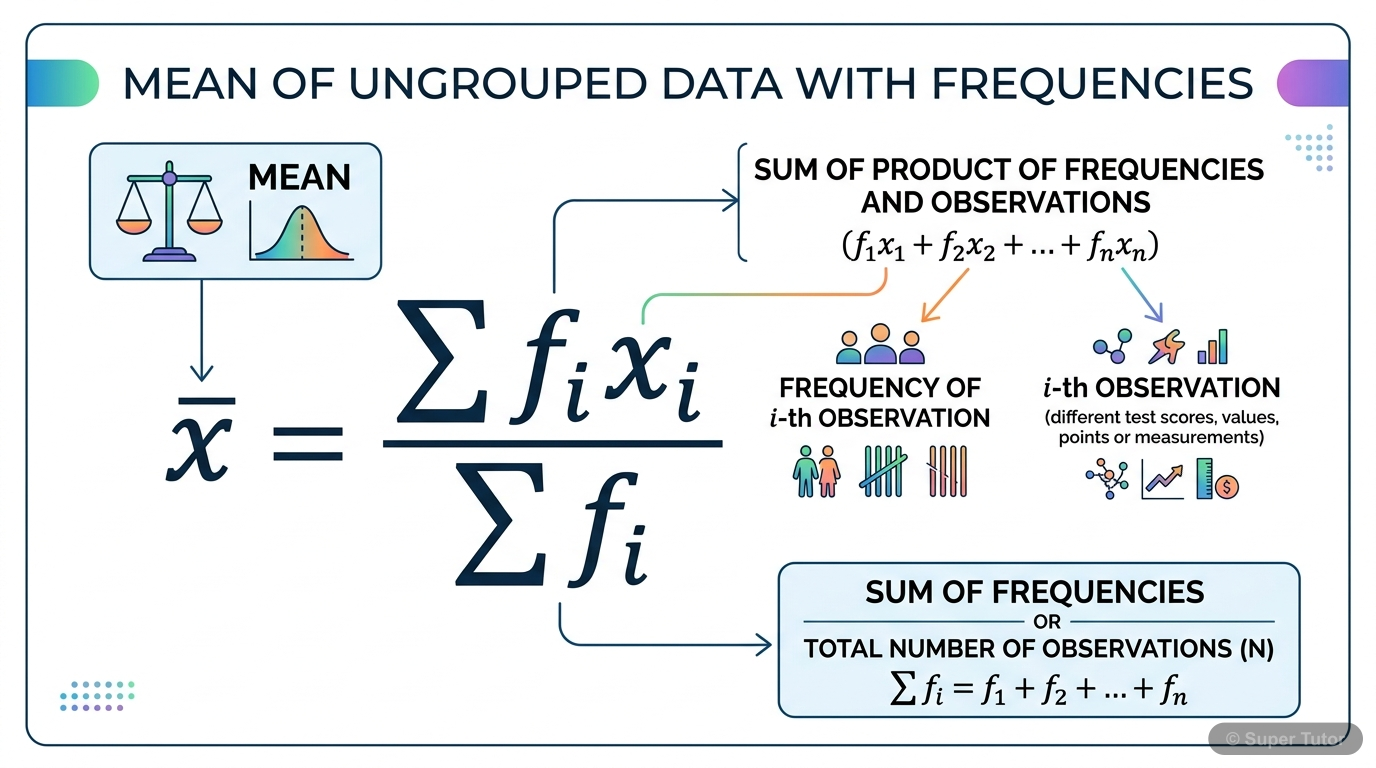
Learn better with visuals Super Tutor pairs illustrations like this with notes and quizzes for Statistics.
Solve the mean of these ungrouped marks: 10, 20, 36, 40, 50, 56, 60, 70, 72, 80, 88, 92, 95 with frequencies 1, 1, 3, 4, 3, 2, 4, 4, 1, 1, 2, 3, 1.
Answer
Step 1: Use the direct method formula: x̄ = Σf_i x_i / Σf_i. Step 2: Add all frequencies: 30. Step 3: Add all f_i x_i values: 1779. Step 4: x̄ = 1779 / 30 = 59.3. Answer: Mean = 59.3.
इन असमूहीकृत अंकों का माध्य ज्ञात कीजिए: 10, 20, 36, 40, 50, 56, 60, 70, 72, 80, 88, 92, 95 with frequencies 1, 1, 3, 4, 3, 2, 4, 4, 1, 1, 2, 3, 1.
Answer
चरण 1: प्रत्यक्ष विधि का सूत्र उपयोग कीजिए: x̄ = Σf_i x_i / Σf_i. चरण 2: सभी आवृत्तियों को जोड़िए: 30. चरण 3: सभी f_i x_i मानों को जोड़िए: 1779. चरण 4: x̄ = 1779 / 30 = 59.3. उत्तर: माध्य = 59.3.
Find the class mark of the class interval 40-55.
Answer
Use the class mark formula: Class mark = (Upper class limit + Lower class limit) / 2 = (55 + 40) / 2 = 95 / 2 = 47.5 Answer: Class mark = 47.5.
प्रदत्त वर्ग अंतराल 40-55 का वर्ग चिह्न ज्ञात कीजिए।
Answer
वर्ग चिह्न का सूत्र उपयोग कीजिए: वर्ग चिह्न = (ऊपरी वर्ग सीमा + निचली वर्ग सीमा) / 2 = (55 + 40) / 2 = 95 / 2 = 47.5 उत्तर: वर्ग चिह्न = 47.5.
Solve the mean of grouped data using class intervals 10-25, 25-40, 40-55, 55-70, 70-85, 85-100 with frequencies 2, 3, 7, 6, 6, 6.
Answer
Step 1: Find class marks: 17.5, 32.5, 47.5, 62.5, 77.5, 92.5. Step 2: Multiply each class mark by frequency and add: Σf_i x_i = 1860. Step 3: Add frequencies: Σf_i = 30. Step 4: Use x̄ = Σf_i x_i / Σf…
वर्ग अंतराल 10-25, 25-40, 40-55, 55-70, 70-85, 85-100 और आवृत्तियाँ 2, 3, 7, 6, 6, 6 का उपयोग करके समूहीकृत आँकड़ों का माध्य ज्ञात कीजिए।
Answer
चरण 1: वर्ग चिह्न ज्ञात कीजिए: 17.5, 32.5, 47.5, 62.5, 77.5, 92.5. चरण 2: प्रत्येक वर्ग चिह्न को आवृत्ति से गुणा करके जोड़िए: Σf_i x_i = 1860. चरण 3: आवृत्तियाँ जोड़िए: Σf_i = 30. चरण 4: x̄ = Σf_i x_i…
Why is the mean of grouped data often only approximate?
Answer
Grouped data uses class marks as representative values for whole class intervals. The assumption is that the frequency of each class interval is centred around its mid-point. Because actual individual…
समूहीकृत आँकड़ों का माध्य अक्सर केवल लगभग क्यों होता है?
Answer
समूहीकृत आँकड़े पूरी वर्ग अंतरालों के लिए प्रतिनिधि मान के रूप में वर्ग चिह्नों का उपयोग करते हैं। यह मान्यता होती है कि प्रत्येक वर्ग अंतराल की आवृत्ति उसके मध्य-बिंदु के आसपास केंद्रित है। क्योंकि व…
+48 more flashcards
Practise AllFrequently Asked Questions
What are the important topics in Statistics for Madhya Pradesh Board Class 10 Mathematics?
How many flashcards are available for Statistics?
How should I revise Statistics for the Madhya Pradesh Board Class 10 board exam?
Sources & Official References
Content is aligned to the official syllabus. Refer to the board website for the latest curriculum.
More resources for Statistics
Practice Quiz
Test yourself with a quick quiz
Important Questions
Exam-style questions with answers
Revision Notes
Key points for last-minute revision
Formula Sheet
The chapter's formulas in one place
Chapter Summary
Understand the chapter at a glance
Concept Maps
See how topics connect
Study Plan
Step-by-step plan for this chapter
Syllabus
What topics to cover
NCERT Solutions
Every textbook question solved step by step
For serious students
Get the full Statistics chapter — start free.
Quizzes, flashcards, an AI doubt solver and a study plan for Madhya Pradesh Board Class 10 Mathematics. Free to start, no card needed.