Statistics — NCERT Solutions
Madhya Pradesh Board · Class 10 · Mathematics
NCERT Solutions for Statistics, Madhya Pradesh Board Class 10 Mathematics: 22 textbook questions solved step by step.
Interactive on Super Tutor
Studying Statistics? Get the full interactive chapter.
Quizzes, flashcards, AI doubt-solver and a step-by-step study plan — built for NCERT solutions and more.
Free trial, no card needed.
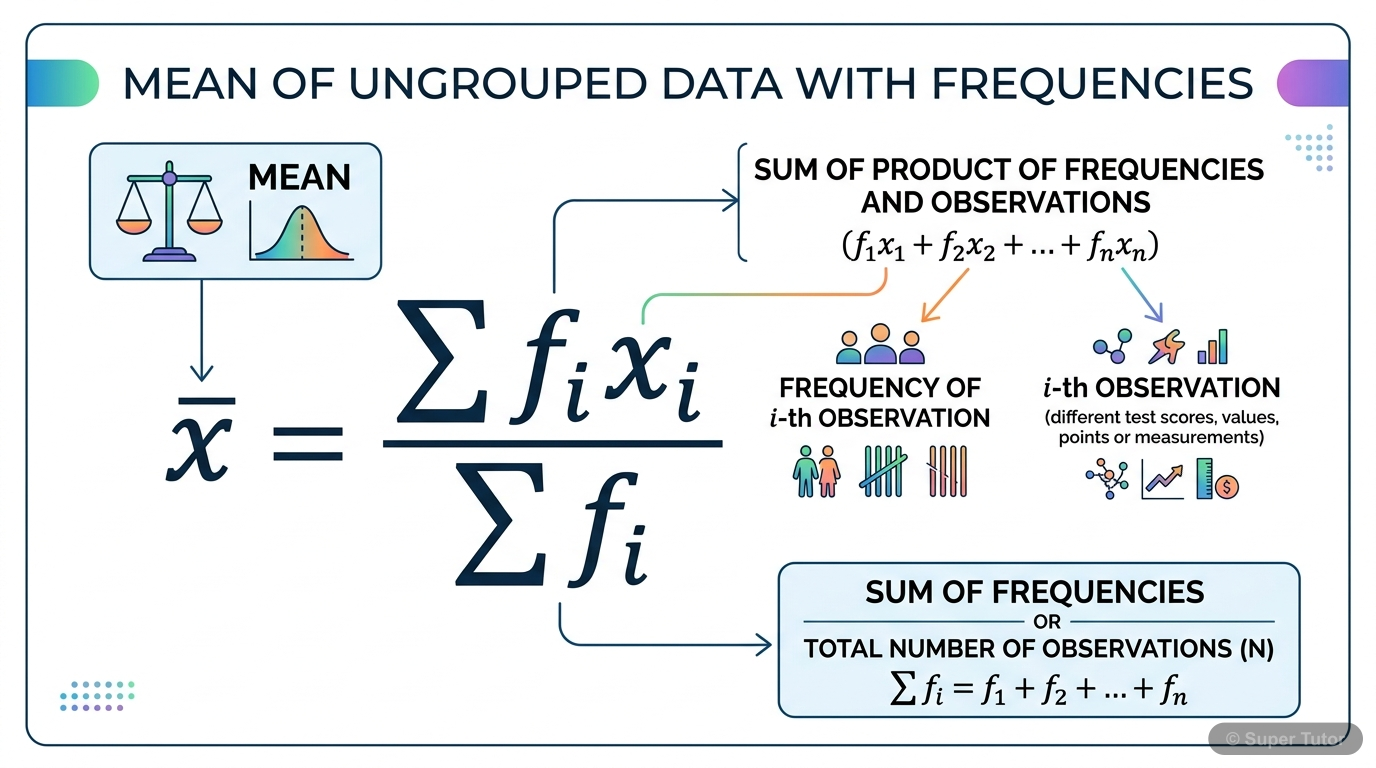
Learn better with visuals Super Tutor pairs illustrations like this with notes and quizzes for Statistics.
The first 11 solutions are open to read. The other 11 are free with a Super Tutor account.
Exercise 13.1
1A survey was conducted by a group of students as a part of their environment awareness programme, in which they collected the following data regarding the number of plants in 20 houses in a locality. Find the mean number of plants per house.
| Number of plants | 0-2 | 2-4 | 4-6 | 6-8 | 8-10 | 10-12 | 12-14 |
|---|---|---|---|---|---|---|---|
| Number of houses | 1 | 2 | 1 | 5 | 6 | 2 | 3 |
Which method did you use for finding the mean, and why?Show solution
Given: Frequency distribution of number of plants in 20 houses.
Method Used: Direct Method (since the values of are small and easy to compute).
Formula:
Step 1: Find the midpoint of each class.
| Class | (midpoint) | ||
|---|---|---|---|
| 0 – 2 | 1 | 1 | 1 |
| 2 – 4 | 2 | 3 | 6 |
| 4 – 6 | 1 | 5 | 5 |
| 6 – 8 | 5 | 7 | 35 |
| 8 – 10 | 6 | 9 | 54 |
| 10 – 12 | 2 | 11 | 22 |
| 12 – 14 | 3 | 13 | 39 |
| Total | 20 | 162 |
Step 2: Calculate the mean.
Answer: The mean number of plants per house is 8.1.
Reason for choosing Direct Method: The class midpoints are small integers, making direct multiplication simple without needing an assumed mean.
2Consider the following distribution of daily wages of 50 workers of a factory.
| Daily wages (in ₹) | 500-520 | 520-540 | 540-560 | 560-580 | 580-600 |
|---|---|---|---|---|---|
| Number of workers | 12 | 14 | 8 | 6 | 10 |
Find the mean daily wages of the workers of the factory by using an appropriate method.Show solution
Given: Frequency distribution of daily wages of 50 workers.
Method Used: Assumed Mean Method (since the values of are large).
Let assumed mean , class width .
Formula:
Step 1: Prepare the table.
| Class | ||||
|---|---|---|---|---|
| 500 – 520 | 12 | 510 | –40 | –480 |
| 520 – 540 | 14 | 530 | –20 | –280 |
| 540 – 560 | 8 | 550 | 0 | 0 |
| 560 – 580 | 6 | 570 | 20 | 120 |
| 580 – 600 | 10 | 590 | 40 | 400 |
| Total | 50 | –240 |
Step 2: Calculate the mean.
Answer: The mean daily wages of the workers is ₹ 545.20.
3The following distribution shows the daily pocket allowance of children of a locality. The mean pocket allowance is Rs 18. Find the missing frequency .
| Daily pocket allowance (in ₹) | 11-13 | 13-15 | 15-17 | 17-19 | 19-21 | 21-23 | 23-25 |
|---|---|---|---|---|---|---|---|
| Number of children | 7 | 6 | 9 | 13 | f | 5 | 4 |Show solution
Given: Mean , one frequency is missing.
Method: Direct Method.
Formula:
Step 1: Prepare the table.
| Class | (midpoint) | ||
|---|---|---|---|
| 11 – 13 | 7 | 12 | 84 |
| 13 – 15 | 6 | 14 | 84 |
| 15 – 17 | 9 | 16 | 144 |
| 17 – 19 | 13 | 18 | 234 |
| 19 – 21 | 20 | ||
| 21 – 23 | 5 | 22 | 110 |
| 23 – 25 | 4 | 24 | 96 |
| Total |
Step 2: Apply the mean formula.
Answer: The missing frequency = 20.
4Thirty women were examined in a hospital by a doctor and the number of heartbeats per minute were recorded and summarised as follows. Find the mean heartbeats per minute for these women, choosing a suitable method.
| Number of heartbeats per minute | 65-68 | 68-71 | 71-74 | 74-77 | 77-80 | 80-83 | 83-86 |
|---|---|---|---|---|---|---|---|
| Number of women | 2 | 4 | 3 | 8 | 7 | 4 | 2 |Show solution
Given: Frequency distribution of heartbeats per minute for 30 women.
Method Used: Assumed Mean Method.
Let assumed mean , class width .
Formula:
Step 1: Prepare the table.
| Class | ||||
|---|---|---|---|---|
| 65 – 68 | 2 | 66.5 | –9 | –18 |
| 68 – 71 | 4 | 69.5 | –6 | –24 |
| 71 – 74 | 3 | 72.5 | –3 | –9 |
| 74 – 77 | 8 | 75.5 | 0 | 0 |
| 77 – 80 | 7 | 78.5 | 3 | 21 |
| 80 – 83 | 4 | 81.5 | 6 | 24 |
| 83 – 86 | 2 | 84.5 | 9 | 18 |
| Total | 30 | 12 |
Step 2: Calculate the mean.
Answer: The mean heartbeats per minute for these women is 75.9 beats per minute.
5In a retail market, fruit vendors were selling mangoes kept in packing boxes. These boxes contained varying number of mangoes. The following was the distribution of mangoes according to the number of boxes.
| Number of mangoes | 50-52 | 53-55 | 56-58 | 59-61 | 62-64 |
|---|---|---|---|---|---|
| Number of boxes | 15 | 110 | 135 | 115 | 25 |
Find the mean number of mangoes kept in a packing box. Which method of finding the mean did you choose?Show solution
Given: The classes are not continuous (gaps exist: 50–52, 53–55, …). We first note that these are inclusive classes. The midpoints are taken directly.
Method Used: Step Deviation Method (since frequencies are large and values are close together).
Let assumed mean , class width .
Formula:
Step 1: Find midpoints and prepare the table.
| Class | ||||
|---|---|---|---|---|
| 50 – 52 | 15 | 51 | –2 | –30 |
| 53 – 55 | 110 | 54 | –1 | –110 |
| 56 – 58 | 135 | 57 | 0 | 0 |
| 59 – 61 | 115 | 60 | 1 | 115 |
| 62 – 64 | 25 | 63 | 2 | 50 |
| Total | 400 | 25 |
Step 2: Calculate the mean.
Answer: The mean number of mangoes kept in a packing box is 57.19 (approximately).
Reason: Step deviation method was chosen because the frequencies are large and the class widths are equal, making calculations simpler.
6The table below shows the daily expenditure on food of 25 households in a locality.
| Daily expenditure (in ₹) | 100-150 | 150-200 | 200-250 | 250-300 | 300-350 |
|---|---|---|---|---|---|
| Number of households | 4 | 5 | 12 | 2 | 2 |
Find the mean daily expenditure on food by a suitable method.Show solution
Given: Frequency distribution of daily food expenditure of 25 households.
Method Used: Step Deviation Method.
Let assumed mean , class width .
Formula:
Step 1: Prepare the table.
| Class | ||||
|---|---|---|---|---|
| 100 – 150 | 4 | 125 | –2 | –8 |
| 150 – 200 | 5 | 175 | –1 | –5 |
| 200 – 250 | 12 | 225 | 0 | 0 |
| 250 – 300 | 2 | 275 | 1 | 2 |
| 300 – 350 | 2 | 325 | 2 | 4 |
| Total | 25 | –7 |
Step 2: Calculate the mean.
Answer: The mean daily expenditure on food is ₹ 211.
7To find out the concentration of SO₂ in the air (in parts per million, i.e., ppm), the data was collected for 30 localities in a certain city and is presented below:
| Concentration of SO₂ (in ppm) | Frequency |
|---|---|
| 0.00 – 0.04 | 4 |
| 0.04 – 0.08 | 9 |
| 0.08 – 0.12 | 9 |
| 0.12 – 0.16 | 2 |
| 0.16 – 0.20 | 4 |
| 0.20 – 0.24 | 2 |
Find the mean concentration of SO₂ in the air.Show solution
Given: Frequency distribution of SO₂ concentration for 30 localities.
Method Used: Direct Method.
Formula:
Step 1: Find midpoints and prepare the table.
| Class | (midpoint) | ||
|---|---|---|---|
| 0.00 – 0.04 | 4 | 0.02 | 0.08 |
| 0.04 – 0.08 | 9 | 0.06 | 0.54 |
| 0.08 – 0.12 | 9 | 0.10 | 0.90 |
| 0.12 – 0.16 | 2 | 0.14 | 0.28 |
| 0.16 – 0.20 | 4 | 0.18 | 0.72 |
| 0.20 – 0.24 | 2 | 0.22 | 0.44 |
| Total | 30 | 2.96 |
Step 2: Calculate the mean.
Answer: The mean concentration of SO₂ in the air is 0.099 ppm (approximately).
8A class teacher has the following absentee record of 40 students of a class for the whole term. Find the mean number of days a student was absent.
| Number of days | 0-6 | 6-10 | 10-14 | 14-20 | 20-28 | 28-38 | 38-40 |
|---|---|---|---|---|---|---|---|
| Number of students | 11 | 10 | 7 | 4 | 4 | 3 | 1 |Show solution
Given: Frequency distribution of absentee days for 40 students.
Method Used: Direct Method.
Formula:
Step 1: Find midpoints and prepare the table.
| Class | (midpoint) | ||
|---|---|---|---|
| 0 – 6 | 11 | 3 | 33 |
| 6 – 10 | 10 | 8 | 80 |
| 10 – 14 | 7 | 12 | 84 |
| 14 – 20 | 4 | 17 | 68 |
| 20 – 28 | 4 | 24 | 96 |
| 28 – 38 | 3 | 33 | 99 |
| 38 – 40 | 1 | 39 | 39 |
| Total | 40 | 499 |
Step 2: Calculate the mean.
Answer: The mean number of days a student was absent is 12.48 days (approximately).
9The following table gives the literacy rate (in percentage) of 35 cities. Find the mean literacy rate.
| Literacy rate (in %) | 45-55 | 55-65 | 65-75 | 75-85 | 85-95 |
|---|---|---|---|---|---|
| Number of cities | 3 | 10 | 11 | 8 | 3 |Show solution
Given: Frequency distribution of literacy rates of 35 cities.
Method Used: Step Deviation Method.
Let assumed mean , class width .
Formula:
Step 1: Prepare the table.
| Class | ||||
|---|---|---|---|---|
| 45 – 55 | 3 | 50 | –2 | –6 |
| 55 – 65 | 10 | 60 | –1 | –10 |
| 65 – 75 | 11 | 70 | 0 | 0 |
| 75 – 85 | 8 | 80 | 1 | 8 |
| 85 – 95 | 3 | 90 | 2 | 6 |
| Total | 35 | –2 |
Step 2: Calculate the mean.
Answer: The mean literacy rate is 69.43% (approximately).
Exercise 13.2
1The following table shows the ages of the patients admitted in a hospital during a year:
| Age (in years) | 5-15 | 15-25 | 25-35 | 35-45 | 45-55 | 55-65 |
|---|---|---|---|---|---|---|
| Number of patients | 6 | 11 | 21 | 23 | 14 | 5 |
Find the mode and the mean of the data given above. Compare and interpret the two measures of central tendency.Show solution
Given: Frequency distribution of ages of patients.
FINDING MODE:
Step 1: Identify the modal class (class with highest frequency).
Highest frequency = 23, which belongs to class 35 – 45.
So, Modal class = 35 – 45.
, , , ,
Formula:
FINDING MEAN:
Let assumed mean , .
| Class | ||||
|---|---|---|---|---|
| 5 – 15 | 6 | 10 | –2 | –12 |
| 15 – 25 | 11 | 20 | –1 | –11 |
| 25 – 35 | 21 | 30 | 0 | 0 |
| 35 – 45 | 23 | 40 | 1 | 23 |
| 45 – 55 | 14 | 50 | 2 | 28 |
| 55 – 65 | 5 | 60 | 3 | 15 |
| Total | 80 | 43 |
Interpretation:
- Mean age ≈ 35.38 years — this is the average age of all patients.
- Mode ≈ 36.8 years — this is the age group most commonly admitted.
Both values are close, indicating that the maximum number of patients admitted are in the age group around 35–45 years.
2The following data gives the information on the observed lifetimes (in hours) of 225 electrical components:
| Lifetimes (in hours) | 0-20 | 20-40 | 40-60 | 60-80 | 80-100 | 100-120 |
|---|---|---|---|---|---|---|
| Frequency | 10 | 35 | 52 | 61 | 38 | 29 |
Determine the modal lifetimes of the components.Show solution
Given: Frequency distribution of lifetimes of 225 electrical components.
Step 1: Identify the modal class.
Highest frequency = 61, which belongs to class 60 – 80.
Modal class = 60 – 80.
, , , ,
Formula:
Answer: The modal lifetime of the components is 65.625 hours.
| Expenditure (in ₹) | Number of families |
|---|---|
| 1000 – 1500 | 24 |
| 1500 – 2000 | 40 |
| 2000 – 2500 | 33 |
| 2500 – 3000 | 28 |
| 3000 – 3500 | 30 |
| 3500 – 4000 | 22 |
| 4000 – 4500 | 16 |
| 4500 – 5000 | 7 |
Free with a Super Tutor account
| Number of students per teacher | Number of states/U.T. |
|---|---|
| 15 – 20 | 3 |
| 20 – 25 | 8 |
| 25 – 30 | 9 |
| 30 – 35 | 10 |
| 35 – 40 | 3 |
| 40 – 45 | 0 |
| 45 – 50 | 0 |
| 50 – 55 | 2 |
Free with a Super Tutor account
| Runs scored | Number of batsmen |
|---|---|
| 3000 – 4000 | 4 |
| 4000 – 5000 | 18 |
| 5000 – 6000 | 9 |
| 6000 – 7000 | 7 |
| 7000 – 8000 | 6 |
| 8000 – 9000 | 3 |
| 9000 – 10000 | 1 |
| 10000 – 11000 | 1 |
Find the mode of the data.
Free with a Super Tutor account
| Number of cars | 0-10 | 10-20 | 20-30 | 30-40 | 40-50 | 50-60 | 60-70 | 70-80 |
|---|---|---|---|---|---|---|---|---|
| Frequency | 7 | 14 | 13 | 12 | 20 | 11 | 15 | 8 |
Free with a Super Tutor account
Exercise 13.3
| Monthly consumption (in units) | Number of consumers |
|---|---|
| 65 – 85 | 4 |
| 85 – 105 | 5 |
| 105 – 125 | 13 |
| 125 – 145 | 20 |
| 145 – 165 | 14 |
| 165 – 185 | 8 |
| 185 – 205 | 4 |
Free with a Super Tutor account
| Class interval | Frequency |
|---|---|
| 0 – 10 | 5 |
| 10 – 20 | x |
| 20 – 30 | 20 |
| 30 – 40 | 15 |
| 40 – 50 | y |
| 50 – 60 | 5 |
| Total | 60 |
Free with a Super Tutor account
| Age (in years) | Number of policy holders |
|---|---|
| Below 20 | 2 |
| Below 25 | 6 |
| Below 30 | 24 |
| Below 35 | 45 |
| Below 40 | 78 |
| Below 45 | 89 |
| Below 50 | 92 |
| Below 55 | 98 |
| Below 60 | 100 |
Free with a Super Tutor account
| Length (in mm) | Number of leaves |
|---|---|
| 118 – 126 | 3 |
| 127 – 135 | 5 |
| 136 – 144 | 9 |
| 145 – 153 | 12 |
| 154 – 162 | 5 |
| 163 – 171 | 4 |
| 172 – 180 | 2 |
Find the median length of the leaves.
(Hint: The data needs to be converted to continuous classes for finding the median, since the formula assumes continuous classes. The classes then change to 117.5 – 126.5, 126.5 – 135.5, ..., 171.5 – 180.5.)
Free with a Super Tutor account
| Life time (in hours) | Number of lamps |
|---|---|
| 1500 – 2000 | 14 |
| 2000 – 2500 | 56 |
| 2500 – 3000 | 60 |
| 3000 – 3500 | 86 |
| 3500 – 4000 | 74 |
| 4000 – 4500 | 62 |
| 4500 – 5000 | 48 |
Find the median life time of a lamp.
Free with a Super Tutor account
| Number of letters | 1-4 | 4-7 | 7-10 | 10-13 | 13-16 | 16-19 |
|---|---|---|---|---|---|---|
| Number of surnames | 6 | 30 | 40 | 16 | 4 | 4 |
Determine the median number of letters in the surnames. Find the mean number of letters in the surnames? Also, find the modal size of the surnames.
Free with a Super Tutor account
| Weight (in kg) | 40-45 | 45-50 | 50-55 | 55-60 | 60-65 | 65-70 | 70-75 |
|---|---|---|---|---|---|---|---|
| Number of students | 2 | 3 | 8 | 6 | 6 | 3 | 2 |
Free with a Super Tutor account
11 more solved questions in Statistics
They are free with a Super Tutor account, along with practice quizzes and flashcards for this chapter. Free to start, no card needed.
Frequently Asked Questions
What are the important topics in Statistics for Madhya Pradesh Board Class 10 Mathematics?
Are these NCERT Solutions for Statistics free?
How should I revise Statistics for the Madhya Pradesh Board Class 10 board exam?
Sources & Official References
Content is aligned to the official syllabus. Refer to the board website for the latest curriculum.
More resources for Statistics
Practice Quiz
Test yourself with a quick quiz
Important Questions
Exam-style questions with answers
Revision Notes
Key points for last-minute revision
Formula Sheet
The chapter's formulas in one place
Chapter Summary
Understand the chapter at a glance
Concept Maps
See how topics connect
Study Plan
Step-by-step plan for this chapter
Flashcards
Quick-fire cards for active recall
Syllabus
What topics to cover
For serious students
Get the full Statistics chapter — start free.
Quizzes, flashcards, an AI doubt solver and a study plan for Madhya Pradesh Board Class 10 Mathematics. Free to start, no card needed.