Measures of Central Tendency — Chapter Summary
ICSE · Class 10 · Mathematics
Summary of Measures of Central Tendency for ICSE Class 10 Mathematics. Part of the ICSE Class 10 Mathematics syllabus.
Interactive on Super Tutor
Studying Measures of Central Tendency? Get the full interactive chapter.
Quizzes, flashcards, AI doubt-solver and a step-by-step study plan — built for chapter summary and more.
Free trial, no card needed.
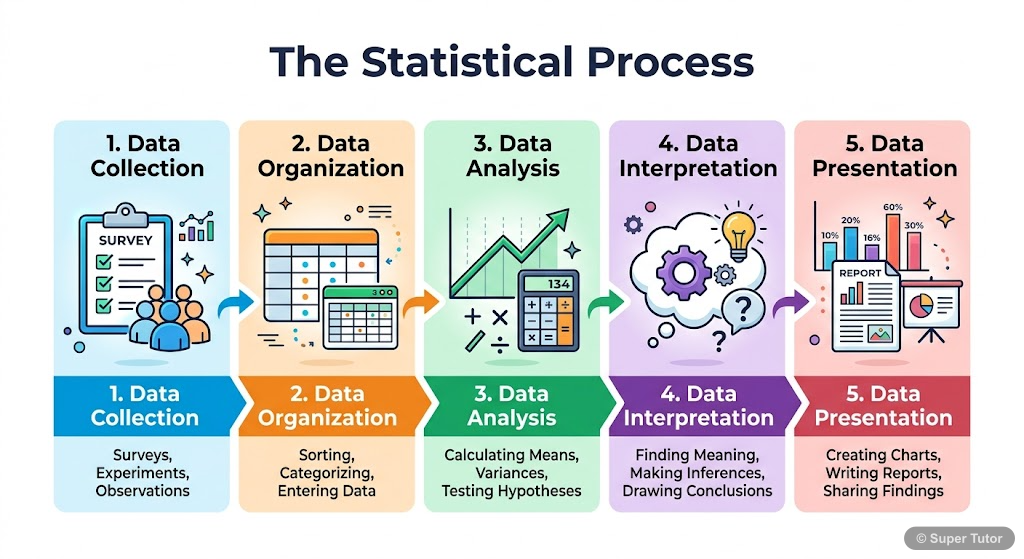
Learn better with visuals Super Tutor pairs illustrations like this with notes and quizzes for Measures of Central Tendency.
Get startedOverview
A numerical value which represents the entire given statistical data is called the measure of central tendency of that data. The three main measures are mean, median and mode. Mean gives the average value, median gives the middle value, and mode gives the most frequent value. The chapter also includ
Key Concepts
Mean is the arithmetic average
Mean is the arithmetic average of a set of observations. For ungrouped data, the mean is the sum of observations divided by the number of observations
For grouped data
For grouped data, mean is found using the formula \(\frac{\Sigma f x}{\Sigma f}\), where f is frequency and x is the value.
This method uses an assumed mean
This method uses an assumed mean A and deviations d = x - A. The formula is \(A+\frac{\sum f d}{\sum f}\).
This method uses an assumed mean
This method uses an assumed mean A and step-deviation t. The formula is \(A+\frac{\sum f t}{\sum f} \times i\), where \(t=\frac{x-A}{f}\) in the sylla
Median is the middle value
Median is the middle value of ordered data. For raw data, if n is odd, the median is the \(\frac{n+1}{2}\) th term. If n is even, it is the average of
Learning Objectives
- To understand the meaning of measures of central tendency
- To study mean, median and mode for raw and grouped data
- To apply all three methods of finding mean: direct, short-cut and step-deviation
- To find median for raw data using the middle-term rule
- To identify median class and modal class in grouped data
Frequently Asked Questions
What are the important topics in Measures of Central Tendency for ICSE Class 10 Mathematics?
How should I revise Measures of Central Tendency for the ICSE Class 10 board exam?
Sources & Official References
Content is aligned to the official syllabus. Refer to the board website for the latest curriculum.
More resources for Measures of Central Tendency
Practice Quiz
Test yourself with a quick quiz
Important Questions
Exam-style questions with answers
Revision Notes
Key points for last-minute revision
Formula Sheet
The chapter's formulas in one place
Concept Maps
See how topics connect
Study Plan
Step-by-step plan for this chapter
Flashcards
Quick-fire cards for active recall
Syllabus
What topics to cover
For serious students
Get the full Measures of Central Tendency chapter — start free.
Quizzes, flashcards, an AI doubt solver and a study plan for ICSE Class 10 Mathematics. Free to start, no card needed.