The Demographic Structure of the Indian Society — Concept Maps
Madhya Pradesh Board · Class 12 · Sociology
4 concept maps of The Demographic Structure of the Indian Society for Madhya Pradesh Board Class 12 Sociology, each also written out as a text outline.
Interactive on Super Tutor
Studying The Demographic Structure of the Indian Society? Get the full interactive chapter.
Quizzes, flashcards, AI doubt-solver and a step-by-step study plan — built for concept maps and more.
Free trial, no card needed.
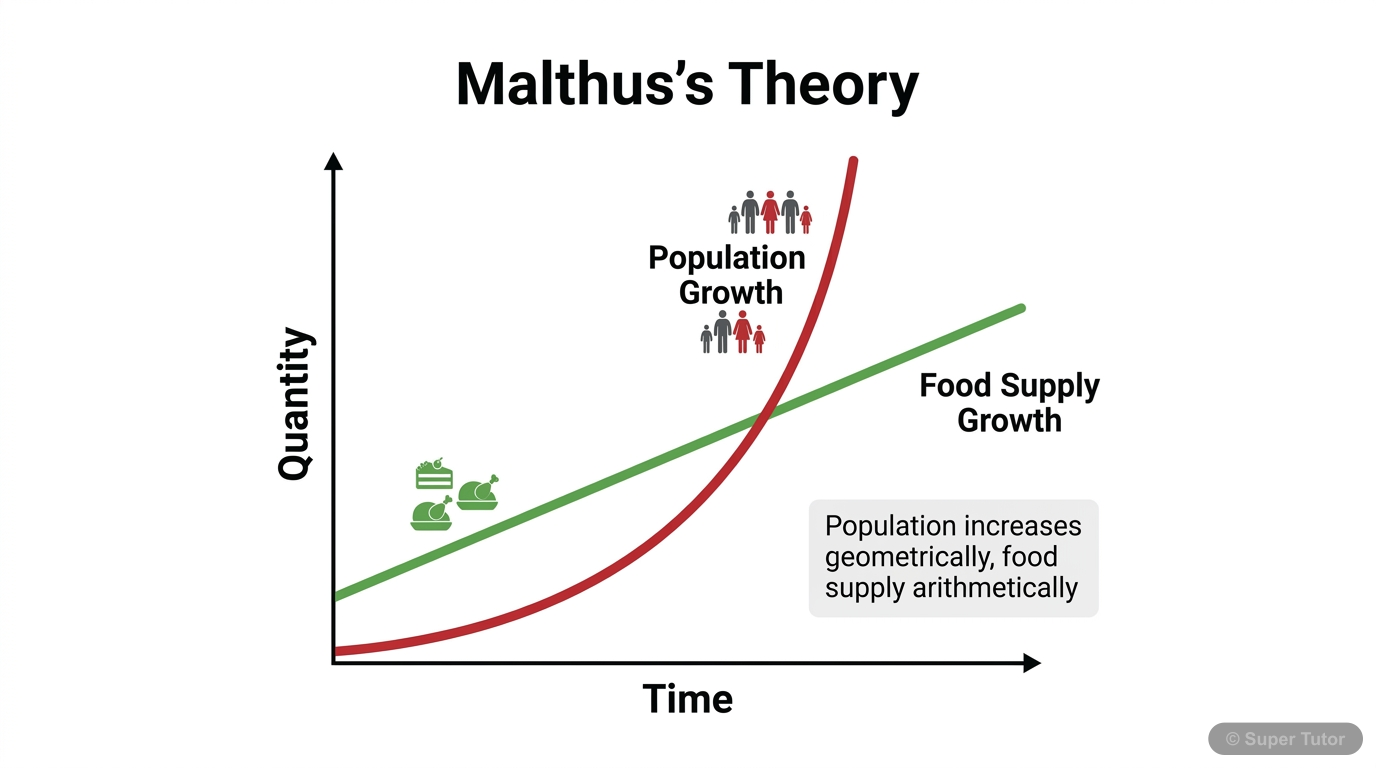
Learn better with visuals Super Tutor pairs illustrations like this with notes and quizzes for The Demographic Structure of the Indian Society.
Complete Chapter Concept Map: Demographic Structure of Indian Society
The map in words
- root((Demography
- Indian Society))
- Definition and Scope
- Greek Origin demos and graphein
- Formal Demography
- Quantitative Analysis
- Mathematical Methods
- Social Demography
- Social and Economic Factors
- Population Studies
- Census and Surveys
- First Modern Census USA 1790
- India Census Since 1881
- Decennial Every 10 Years
- Demographic Theories
- Malthusian Theory 1798
- Geometric Population Growth
- Arithmetic Food Growth
- Preventive Checks
- Positive Checks Famine Disease
- Criticised by Liberals and Marxists
- Demographic Transition Theory
- Stage 1 High Birth High Death
- Stage 2 Transitional High Growth
- Stage 3 Low Birth Low Death
- Population Explosion
- Malthusian Theory 1798
- Key Indicators
- Birth Rate
- Births per 1000 Population
- Death Rate
- Deaths per 1000 Population
- Fertility Rate
- Births per 1000 Women Age 15 to 49
- Infant Mortality Rate
- Deaths under 1 Year per 1000 Births
- Maternal Mortality Rate
- Deaths per 100000 Births
- Life Expectancy
- Estimated Years of Survival
- Sex Ratio
- Females per 1000 Males
- Dependency Ratio
- Non Workers to Workers Ratio
- Birth Rate
- Size and Growth
- 1.21 Billion in 2011
- Negative Growth 1911 to 1921
- Influenza Epidemic 1918-19
- Growth Rate Peak 2.22 Percent 1961 to 1971
- Growth Rate Declining After 1981
- Bihar and UP Highest Birth Rates
- Age Structure
- Young Population
- 0 to 14 Age Group 29 Percent in 2011
- Working Age 15 to 59 at 63 Percent
- Aged 60 Plus Rising to 8 Percent
- Demographic Dividend
- Large Working Age Cohort
- Lower Dependency Ratio
- Requires Education and Employment
- Population Pyramids
- 1961 Wide Base
- 2026 Bulge in Middle
- Regional Contrast
- Kerala Older Profile
- Uttar Pradesh Younger Profile
- Declining Sex Ratio
- Overall 943 in 2011
- Child Sex Ratio 919 in 2011
- Son Preference
- Female Foeticide via Ultrasound
- Female Infanticide
- PCPNDT Act 1996
- Beti Bachao Beti Padhao
- Haryana Worst at 793
- Literacy
- 73 Percent Overall in 2011
- Male 80.9 Percent
- Female 64.6 Percent
- Gap Narrowing Over Decades
- SC and ST Lower Literacy
- Kerala Near Universal
- Bihar Lags Behind
- Rural Urban Differences
- 68.8 Percent Rural in 2011
- Urbanisation Rising
- Rural to Urban Migration
- Search for Work
- Loss of Common Resources
- Social Anonymity
- Metropolis Growth
- 5161 Towns and Cities
- Population Policy
- Family Planning Programme 1952
- Emergency Coercive Sterilisation 1975-76
- National Population Policy 2000
- National Health Policy 2017
- TFR Target 2.1 by 2025
- Maternal Mortality Target 100 by 2020
- Definition and Scope
Chapter Overview: Demographic Structure of Indian Society
The map in words
- Indian Demography
- Key Theories
- Malthusian Theory
- Geometric vs Arithmetic
- Preventive Checks
- Positive Checks
- Demographic Transition
- Stage 1 High-High
- Stage 2 Explosion
- Stage 3 Low-Low
- Malthusian Theory
- Key Concepts
- Birth Rate
- Death Rate
- Growth Rate
- Sex Ratio
- IMR and MMR
- Dependency Ratio
- Life Expectancy
- Population Trends
- 1921 Great Divide
- 1918 Influenza
- Census since 1881
- 121 crore in 2011
- Age Structure
- Young Population
- Demographic Dividend
- State Variations
- UP vs Kerala
- Sex Ratio Crisis
- 943 overall 2011
- Child sex ratio 919
- Haryana 793
- PNDT Act 1996
- Literacy
- 73 percent 2011
- Male 80.9 percent
- Female 64.6 percent
- Gender Gap 16.3 percent
- Rural Urban
- Rural 68.8 percent
- Urban 31.2 percent
- Urbanisation trend
- Metro growth
- Population Policy
- 1952 First Policy
- Emergency 1975
- NFWP renamed
- NHP 2017
- Key Theories
Demographic Structure of Indian Society — Complete Concept Map
The map in words
- Demographic Structure of India
- Demography
- Formal Demography
- Quantitative Methods
- Population Forecasting
- Social Demography
- Social Causes
- Economic Factors
- Census in India
- Started 1867 to 72
- Decennial since 1881
- 2011 Latest Census
- Formal Demography
- Population Theories
- Malthus Theory
- Geometric vs Arithmetic Growth
- Preventive Checks
- Positive Checks
- Criticised by Marxists
- Demographic Transition
- Stage 1 High High Low Growth
- Stage 2 Transitional Explosion
- Stage 3 Low Low Stable
- Malthus Theory
- Key Indicators
- Birth Rate
- Death Rate
- Growth Rate
- TFR
- IMR and MMR
- Sex Ratio
- Dependency Ratio
- Life Expectancy
- Indian Population
- 1.21 Billion in 2011
- Growth Rate Trends
- Regional Fertility Variations
- Demographic Dividend
- Sex Ratio Issues
- Overall Declining Trend
- Child Sex Ratio Crisis
- Son Preference
- PNDT Act 1996
- Beti Bachao Beti Padhao
- Literacy
- 73 Percent in 2011
- Gender Gap 16.3 Percent
- Regional Disparities
- Caste Based Disparities
- Urbanisation
- 31.2 Percent Urban 2011
- Rural to Urban Migration
- Push Factors
- Pull Factors
- Population Policy
- National Family Planning 1952
- Emergency Coercion 1975 to 76
- National Population Policy 2000
- National Health Policy 2017
- Demography
Demography and the changing structure of India’s population
The map in words
- Demography and the changing structure of India’s population
- Demography
- Formal demography
- Social demography
- Malthusian theory
- Demographic transition
- Population indicators
- India’s population growth
- Age structure
Explore these maps interactively
Explore DiagramsFrequently Asked Questions
What are the important topics in The Demographic Structure of the Indian Society for Madhya Pradesh Board Class 12 Sociology?
What do the concept maps for The Demographic Structure of the Indian Society show?
How should I revise The Demographic Structure of the Indian Society for the Madhya Pradesh Board Class 12 board exam?
Sources & Official References
Content is aligned to the official syllabus. Refer to the board website for the latest curriculum.
More resources for The Demographic Structure of the Indian Society
Practice Quiz
Test yourself with a quick quiz
Important Questions
Exam-style questions with answers
Revision Notes
Key points for last-minute revision
Formula Sheet
The chapter's formulas in one place
Chapter Summary
Understand the chapter at a glance
Study Plan
Step-by-step plan for this chapter
Flashcards
Quick-fire cards for active recall
Syllabus
What topics to cover
NCERT Solutions
Every textbook question solved step by step
For serious students
Get the full The Demographic Structure of the Indian Society chapter — start free.
Quizzes, flashcards, an AI doubt solver and a study plan for Madhya Pradesh Board Class 12 Sociology. Free to start, no card needed.