Analysis of Financial Statements — NCERT Solutions
Madhya Pradesh Board · Class 12 · Accountancy
NCERT Solutions for Analysis of Financial Statements, Madhya Pradesh Board Class 12 Accountancy: 40 textbook questions solved step by step.
Interactive on Super Tutor
Studying Analysis of Financial Statements? Get the full interactive chapter.
Quizzes, flashcards, AI doubt-solver and a step-by-step study plan — built for NCERT solutions and more.
Free trial, no card needed.
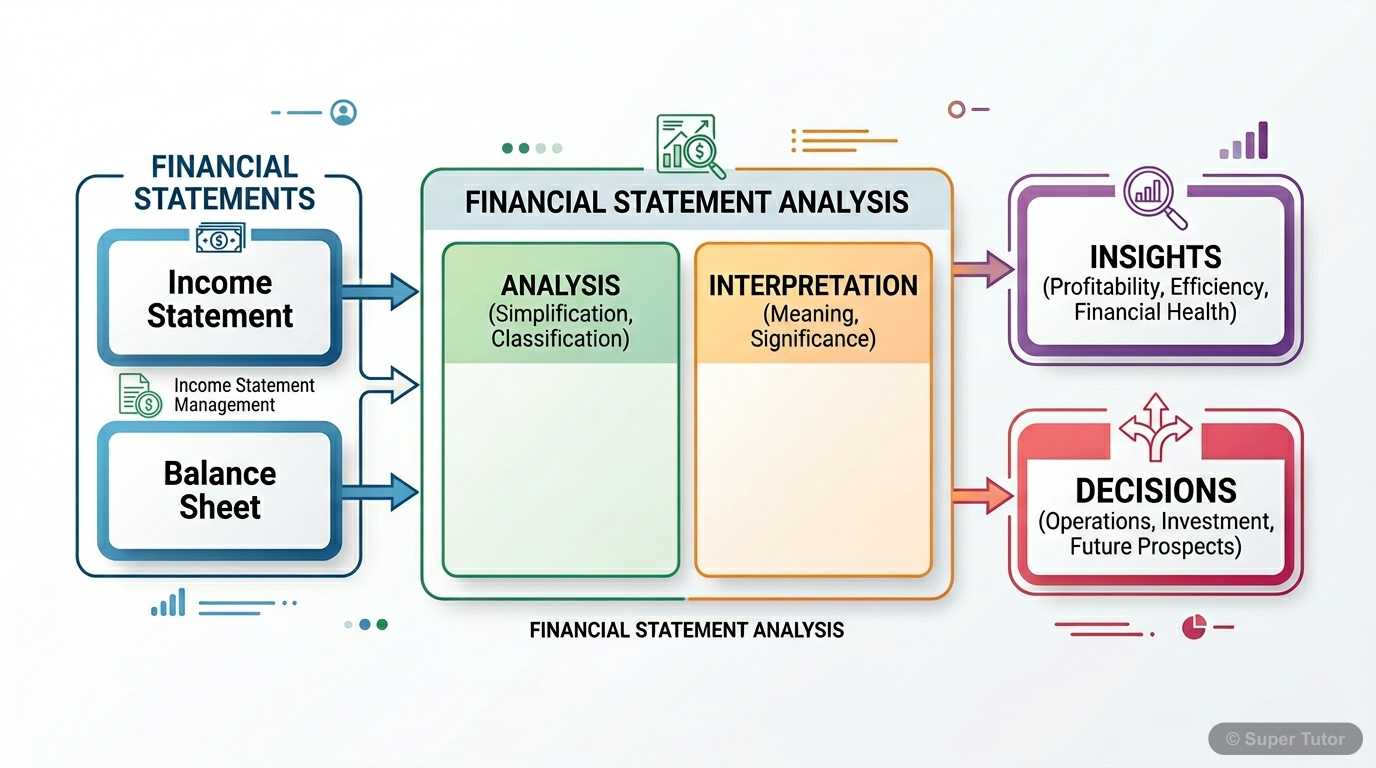
Learn better with visuals Super Tutor pairs illustrations like this with notes and quizzes for Analysis of Financial Statements.
The first 20 solutions are open to read. The other 20 are free with a Super Tutor account.
Test your Understanding - I (Fill in the Blanks)
1Analysis simply means ---data.Show solution
Analysis simply means simplifying data.
Explanation: Analysis involves breaking down complex financial data into simpler components so that it can be understood and examined more easily.
2Interpretation means ---data.Show solution
Interpretation means explaining data.
Explanation: Interpretation involves explaining the meaning and significance of the analysed data so that conclusions can be drawn and decisions can be made.
3Comparative analysis is also known as --- analysis.Show solution
Comparative analysis is also known as Horizontal analysis.
Explanation: Comparative (horizontal) analysis compares financial data across two or more periods side by side, showing changes over time.
4Common size analysis is also known as --- analysis.Show solution
Common size analysis is also known as Vertical analysis.
Explanation: In vertical (common size) analysis, each item in the financial statement is expressed as a percentage of a common base figure (e.g., total assets or revenue from operations).
5The analysis of actual movement of money inflow and outflow in an organisation is called --- analysis.Show solution
The analysis of actual movement of money inflow and outflow in an organisation is called Cash Flow analysis.
Explanation: Cash flow analysis studies the actual movement of cash into (inflow) and out of (outflow) an organisation during an accounting period.
Do it Yourself — Comparative Statement of Profit and Loss (Narang Colours Ltd.)
1From the following particulars, prepare comparative statement of profit and loss of Narang Colours Ltd. for the year ended March 31, 2016 and 2017:
| Particulars | 2016-17 (Rs.) | 2015-16 (Rs.) |
|---|---|---|
| Revenue from operations | 40,00,000 | 35,00,000 |
| Other income | 50,000 | 50,000 |
| Cost of material consumed | 15,00,000 | 18,00,000 |
| Changes in inventories | 10,000 | (15,000) |
| Employee benefit expenses | 2,40,000 | 2,40,000 |
| Depreciation and amortisation | 25,000 | 22,500 |
| Other expenses (incl. tax) | 2,66,000 | 3,02,000 |
| Profit | 20,09,000 | 14,27,300 |Show solution
Given Information:
- Revenue from operations, other income, various expenses for 2015-16 and 2016-17.
- Other expenses include provision for tax (Rs. 50,000 for 2016-17 and Rs. 60,000 for 2015-16).
Step 1: Separate tax from other expenses.
Other expenses (excluding tax):
- 2016-17: Rs. 2,66,000 − Rs. 50,000 = Rs. 2,16,000
- 2015-16: Rs. 3,02,000 − Rs. 60,000 = Rs. 2,42,000
Step 2: Calculate Total Revenue (I)
- 2016-17: Rs. 40,00,000 + Rs. 50,000 = Rs. 40,50,000
- 2015-16: Rs. 35,00,000 + Rs. 50,000 = Rs. 35,50,000
Step 3: Calculate Total Expenses (II) before tax
| Expense | 2016-17 (Rs.) | 2015-16 (Rs.) |
|---|---|---|
| Cost of material consumed | 15,00,000 | 18,00,000 |
| Changes in inventories | 10,000 | (15,000) |
| Employee benefit expenses | 2,40,000 | 2,40,000 |
| Depreciation & amortisation | 25,000 | 22,500 |
| Other expenses (excl. tax) | 2,16,000 | 2,42,000 |
| Total Expenses | 19,91,000 | 22,89,500 |
Step 4: Profit before tax = Total Revenue − Total Expenses
- 2016-17: Rs. 40,50,000 − Rs. 19,91,000 = Rs. 20,59,000
- 2015-16: Rs. 35,50,000 − Rs. 22,89,500 = Rs. 12,60,500
Step 5: Less Tax
- 2016-17: Rs. 50,000
- 2015-16: Rs. 60,000
Step 6: Profit after tax
- 2016-17: Rs. 20,59,000 − Rs. 50,000 = Rs. 20,09,000 ✓
- 2015-16: Rs. 12,60,500 − Rs. 60,000 = Rs. 12,00,500
(Note: The profit figure given for 2015-16 is Rs. 14,27,300 in the question. The slight discrepancy may be due to rounding or additional items not separately listed. The statement is prepared using the data as given.)
Step 7: Calculate Absolute Change and Percentage Change
Comparative Statement of Profit and Loss of Narang Colours Ltd.
For the years ended March 31, 2016 and March 31, 2017
| Particulars | 2015-16 (Rs.) | 2016-17 (Rs.) | Absolute Change (Rs.) | % Change |
|---|---|---|---|---|
| I. Revenue | ||||
| Revenue from operations | 35,00,000 | 40,00,000 | +5,00,000 | +14.29% |
| Other income | 50,000 | 50,000 | 0 | 0% |
| Total Revenue (I) | 35,50,000 | 40,50,000 | +5,00,000 | +14.08% |
| II. Expenses | ||||
| Cost of material consumed | 18,00,000 | 15,00,000 | −3,00,000 | −16.67% |
| Changes in inventories | (15,000) | 10,000 | +25,000 | — |
| Employee benefit expenses | 2,40,000 | 2,40,000 | 0 | 0% |
| Depreciation & amortisation | 22,500 | 25,000 | +2,500 | +11.11% |
| Other expenses (excl. tax) | 2,42,000 | 2,16,000 | −26,000 | −10.74% |
| Total Expenses (II) | 22,89,500 | 19,91,000 | −2,98,500 | −13.04% |
| Profit before tax (I−II) | 12,60,500 | 20,59,000 | +7,98,500 | +63.35% |
| Less: Provision for tax | 60,000 | 50,000 | −10,000 | −16.67% |
| Profit after tax | 12,00,500 | 20,09,000 | +8,08,500 | +67.34% |
Do it Yourself — Comparative Balance Sheet (Omega Chemicals Ltd.)
1From the Balance Sheets for the year ended March 31, 2016 and 2017, prepare the comparative Balance Sheet of Omega Chemicals Ltd. (Rs. in Lakhs):
Equity & Liabilities: Share capital 2017: 5, 2016: 10; Reserve & surplus 2017: 3, 2016: 2; Long-term borrowings 2017: 5, 2016: 8; Trade Payable 2017: 2, 2016: 4; Total 2017: 15, 2016: 24 (Note: Assets side shows Total 24 for 2016 and 15 for 2017)
Assets: Tangible assets 2017: 14, 2016: 8; Intangible assets 2017: 3, 2016: 2; Inventories 2017: 5, 2016: 4; Cash and cash equivalents 2017: 2, 2016: 1; Total 2017: 24, 2016: 15Show solution
Note: There appears to be a transposition in the OCR — the Assets side totals (24 for 2016, 15 for 2017) match the Equity & Liabilities side if we swap the years. We solve using the data as consistently presented: 2016 total = 24 Lakhs, 2017 total = 15 Lakhs for Equity & Liabilities; and Assets 2016 = 15, 2017 = 24. We use the Equity & Liabilities figures as the primary reference and match Assets accordingly.
Given:
- 2016: Share capital = 10, Reserve & surplus = 2, Long-term borrowings = 8, Trade Payable = 4, Total = 24
- 2017: Share capital = 5, Reserve & surplus = 3, Long-term borrowings = 5, Trade Payable = 2, Total = 15
Assets (as given in the text):
- Tangible assets: 2016 = 8, 2017 = 14
- Intangible assets: 2016 = 2, 2017 = 3
- Inventories: 2016 = 4, 2017 = 5
- Cash and cash equivalents: 2016 = 1, 2017 = 2
- Total Assets: 2016 = 15, 2017 = 24
Formula:
Comparative Balance Sheet of Omega Chemicals Ltd.
As at March 31, 2016 and March 31, 2017
(Rs. in Lakhs)
| Particulars | 2016 (Rs.) | 2017 (Rs.) | Absolute Change (Rs.) | % Change |
|---|---|---|---|---|
| I. Equity and Liabilities | ||||
| 1. Shareholders' Funds | ||||
| Share capital | 10 | 5 | −5 | −50.00% |
| Reserve and surplus | 2 | 3 | +1 | +50.00% |
| 2. Non-current Liabilities | ||||
| Long-term borrowings | 8 | 5 | −3 | −37.50% |
| 3. Current Liabilities | ||||
| Trade Payable | 4 | 2 | −2 | −50.00% |
| Total | 24 | 15 | −9 | −37.50% |
| II. Assets | ||||
| 1. Non-current Assets | ||||
| Tangible assets | 8 | 14 | +6 | +75.00% |
| Intangible assets | 2 | 3 | +1 | +50.00% |
| 2. Current Assets | ||||
| Inventories | 4 | 5 | +1 | +25.00% |
| Cash and cash equivalents | 1 | 2 | +1 | +100.00% |
| Total | 15 | 24 | +9 | +60.00% |
Observation: The total of Equity & Liabilities (2016 = 24, 2017 = 15) does not match the total of Assets (2016 = 15, 2017 = 24), indicating a likely printing error in the source where the year columns for Assets were swapped. Students should note this discrepancy.
Do it Yourself — Common Size Balance Sheet (Raj Co. Ltd.)
1Prepare common size balance sheet of Raj Co. Ltd. as at March 31, 2016 and March 31, 2017 from the given information:
Equity & Liabilities: Share capital 2017: 20,00,000; 2016: 15,00,000 | Reserve & surplus 2017: 3,00,000; 2016: 4,00,000 | Long-term borrowings 2017: 9,00,000; 2016: 6,00,000 | Trade payables 2017: 3,00,000; 2016: 2,00,000 | Total 2017: 35,00,000; 2016: 27,00,000
Assets: Tangible assets 2017: 20,00,000; 2016: 15,00,000 | Intangible assets 2017: 9,00,000; 2016: 6,00,000 | Inventories 2017: 3,00,000; 2016: 4,00,000 | Cash and cash equivalents 2017: 3,00,000; 2016: 2,00,000 | Total 2017: 35,00,000; 2016: 27,00,000Show solution
Concept Used: In a Common Size Balance Sheet, each item is expressed as a percentage of Total Assets (or Total Liabilities), which is taken as 100.
Calculations for 2016-17 (Total = Rs. 35,00,000):
- Share capital:
- Reserve & surplus:
- Long-term borrowings:
- Trade payables:
- Tangible assets:
- Intangible assets:
- Inventories:
- Cash & cash equivalents:
Calculations for 2015-16 (Total = Rs. 27,00,000):
- Share capital:
- Reserve & surplus:
- Long-term borrowings:
- Trade payables:
- Tangible assets:
- Intangible assets:
- Inventories:
- Cash & cash equivalents:
Common Size Balance Sheet of Raj Co. Ltd.
As at March 31, 2016 and March 31, 2017
| Particulars | 2016-17 (Rs.) | 2015-16 (Rs.) | % of Total 2016-17 | % of Total 2015-16 |
|---|---|---|---|---|
| I. Equity and Liabilities | ||||
| 1. Shareholders' Funds | ||||
| Share capital | 20,00,000 | 15,00,000 | 57.14 | 55.56 |
| Reserve & surplus | 3,00,000 | 4,00,000 | 8.57 | 14.81 |
| 2. Non-current Liabilities | ||||
| Long-term borrowings | 9,00,000 | 6,00,000 | 25.71 | 22.22 |
| 3. Current Liabilities | ||||
| Trade payables | 3,00,000 | 2,00,000 | 8.57 | 7.41 |
| Total | 35,00,000 | 27,00,000 | 100 | 100 |
| II. Assets | ||||
| 1. Non-current Assets | ||||
| Tangible assets | 20,00,000 | 15,00,000 | 57.14 | 55.56 |
| Intangible assets | 9,00,000 | 6,00,000 | 25.71 | 22.22 |
| 2. Current Assets | ||||
| Inventories | 3,00,000 | 4,00,000 | 8.57 | 14.81 |
| Cash and cash equivalents | 3,00,000 | 2,00,000 | 8.57 | 7.41 |
| Total | 35,00,000 | 27,00,000 | 100 | 100 |
Test your Understanding - II (MCQs)
1The financial statements of a business enterprise include:
(a) Balance sheet
(b) Statement of Profit and loss account
(c) Cash flow statement
(d) All the aboveShow solution
Correct Answer: (d) All the above
Financial statements of a business enterprise include the Balance Sheet (showing financial position), Statement of Profit and Loss (showing operational performance), and Cash Flow Statement (showing movement of cash). All three together constitute the complete set of financial statements.
2The most commonly used tools for financial analysis are:
(a) Horizontal analysis
(b) Vertical analysis
(c) Ratio analysis
(d) All the aboveShow solution
Correct Answer: (d) All the above
Horizontal analysis (comparative statements), vertical analysis (common size statements), and ratio analysis are all commonly used tools for financial analysis. Each serves a different purpose in evaluating the financial health of an enterprise.
3An Annual Report is issued by a company to its:
(a) Directors
(b) Auditors
(c) Shareholders
(d) ManagementShow solution
Correct Answer: (c) Shareholders
An Annual Report is issued by a company to its shareholders. It contains financial statements, management discussion, and other relevant information to keep shareholders informed about the company's performance and financial position.
4Balance Sheet provides information about financial position of the enterprise:
(a) At a point in time
(b) Over a period of time
(c) For a period of time
(d) None of the aboveShow solution
Correct Answer: (a) At a point in time
A Balance Sheet is a static statement that shows the financial position (assets, liabilities, and equity) of an enterprise at a specific date (e.g., March 31, 2017). It is not prepared for a period but for a particular point in time.
5Comparative statements are also known as:
(a) Dynamic analysis
(b) Horizontal analysis
(c) Vertical analysis
(d) External analysisShow solution
Correct Answer: (b) Horizontal analysis
Comparative statements compare financial data across two or more time periods side by side (horizontally), hence they are also known as Horizontal Analysis. This helps in identifying trends and changes over time.
Test your Understanding - III (True or False)
(a)The financial statements of a business enterprise include cash flow statement.Show solution
True.
Financial statements of a business enterprise include the Balance Sheet, Statement of Profit and Loss, and Cash Flow Statement. The Cash Flow Statement is an integral part of the financial statements.
(b)Comparative statements are the form of horizontal analysis.Show solution
True.
Comparative statements compare financial data of two or more periods placed side by side (i.e., horizontally), and are therefore a form of horizontal analysis.
(c)Common size statements and financial ratios are the two tools employed in vertical analysis.Show solution
True.
Vertical analysis involves expressing each item as a percentage of a base figure within the same period. Common size statements and financial ratios both involve this type of within-period comparison, making them tools of vertical analysis.
(d)Ratio analysis establishes relationship between two financial statements.Show solution
False.
Ratio analysis establishes a relationship between two items (or groups of items) within the same financial statement or across financial statements. It does not merely establish a relationship between two complete financial statements.
(e)Ratio analysis is a tool for analysing the financial statements of any enterprise.Show solution
True.
Ratio analysis is a widely used tool for analysing the financial statements of any enterprise. It helps assess profitability, liquidity, solvency, and efficiency of the enterprise.
(f)Financial analysis is used only by the creditors.Show solution
False.
Financial analysis is used by a wide range of users including investors, creditors, management, employees, government, and the general public — not only by creditors.
(g)Statement of profit and loss account shows the operating performance of an enterprise for a period of time.Show solution
True.
The Statement of Profit and Loss is a dynamic statement that shows the revenues earned and expenses incurred during a specific accounting period, thereby reflecting the operating performance of the enterprise over that period.
Free with a Super Tutor account
Free with a Super Tutor account
Free with a Super Tutor account
Short Answer Questions
Free with a Super Tutor account
Free with a Super Tutor account
Free with a Super Tutor account
Free with a Super Tutor account
Free with a Super Tutor account
Free with a Super Tutor account
Long Answer Questions
Free with a Super Tutor account
Free with a Super Tutor account
Free with a Super Tutor account
Free with a Super Tutor account
Free with a Super Tutor account
Numerical Questions
| Particulars | March 31, 2016 (Rs.) | March 31, 2017 (Rs.) |
|---|---|---|
| Share Capital | 2,00,000 | 4,00,000 |
| Reserve & Surplus | 1,00,000 | 1,50,000 |
| Long Term Borrowings | 2,00,000 | 3,00,000 |
| Short term borrowings | 50,000 | 70,000 |
| Trade Payables | 30,000 | 60,000 |
| Other Current Liabilities | 20,000 | 10,000 |
| Short Terms Provisions | 20,000 | 20,000 |
| Total | 6,20,000 | 10,20,000 |
| Fixed Assets | 2,00,000 | 5,00,000 |
| Non-Current Investments | 1,00,000 | 1,25,000 |
| Current Investments | 60,000 | 80,000 |
| Inventories | 1,35,000 | 1,55,000 |
| Trade Receivables | 60,000 | 90,000 |
| Cash and Cash Equivalents | 25,000 | 10,000 |
| Short term Loans & Advances | 40,000 | 60,000 |
| Total | 6,20,000 | 10,20,000 |
Free with a Super Tutor account
| Particulars | March 31, 2016 (Rs.) | March 31, 2017 (Rs.) |
|---|---|---|
| Share Capital | 4,00,000 | 3,00,000 |
| Reserves and surplus | 1,50,000 | 1,00,000 |
| Long term IDBI | 3,00,000 | 1,00,000 |
| Short term borrowings | 70,000 | 50,000 |
| Trade payables | 60,000 | 30,000 |
| Other current liabilities | 1,10,000 | 1,00,000 |
| Short term provisions | 10,000 | 20,000 |
| Total | 11,00,000 | 7,00,000 |
| Fixed Assets | 4,00,000 | 2,20,000 |
| Non-current Investments | 2,25,000 | 1,00,000 |
| Current Investments | 80,000 | 60,000 |
| Inventories | 1,05,000 | 90,000 |
| Trade Receivables | 90,000 | 60,000 |
| Cash and Cash Equivalents | 1,00,000 | 85,000 |
| Short term loans & Advances | 1,00,000 | 85,000 |
| Total | 11,00,000 | 7,00,000 |
Free with a Super Tutor account
| Particulars | 2015-16 (Rs.) | 2016-17 (Rs.) |
|---|---|---|
| Freight Outward | 20,000 | 10,000 |
| Wages (office) | 10,000 | 5,000 |
| Manufacturing Expenses | 50,000 | 20,000 |
| Stock adjustment | (60,000) | 30,000 |
| Cash purchases | 80,000 | 60,000 |
| Credit purchases | 60,000 | 20,000 |
| Return inward | 8,000 | 4,000 |
| Gross profit | (30,000) | 90,000 |
| Carriage outward | 20,000 | 10,000 |
| Machinery | 3,00,000 | 2,00,000 |
| 10% depreciation on machinery | 10,000 | 5,000 |
| Interest on short-term loans | 20,000 | 20,000 |
| 10% debentures | 20,000 | 10,000 |
| Profit on sale of furniture | 20,000 | 10,000 |
| Loss on sale of office car | 90,000 | 60,000 |
| Tax rate | 40% | 50% |
Free with a Super Tutor account
| Particulars | 2015-16 (Rs.) | 2016-17 (Rs.) |
|---|---|---|
| Manufacturing expenses | 35,000 | 80,000 |
| Opening stock | 30,000 | 60% of closing stock |
| Sales | 9,60,000 | 4,50,000 |
| Returns outward | 4,000 (out of credit purchase) | 6,000 (out of cash purchase) |
| Closing stock | 150% of opening stock | 1,00,000 |
| Credit purchases | 1,50,000 | 150% of cash purchase |
| Cash purchases | 80% of credit purchases | 40,000 |
| Carriage outward | 10,000 | 30,000 |
| Building | 1,00,000 | 2,00,000 |
| Depreciation on building | 20% | 10% |
| Interest on bank overdraft | 5,000 | - |
| 10% debentures | 2,00,000 | 20,00,000 |
| Profit on sale of copyright | 10,000 | 20,000 |
| Loss on sale of personal car | 10,000 | 20,000 |
| Other operating expenses | 20,000 | 10,000 |
| Tax rate | 50% | 40% |
Free with a Super Tutor account
| Particulars | 2015-16 (Rs.) | 2016-17 (Rs.) |
|---|---|---|
| Revenue from operations | 6,00,000 | 8,00,000 |
| Indirect expense | 25% of gross profit | 25% of gross profit |
| Cost of revenue from operations | 4,28,000 | 7,28,000 |
| Other incomes | 10,000 | 12,000 |
| Income tax | 30% | 30% |
Free with a Super Tutor account
| Particulars | Aditya Ltd. (Rs.) | Anjali Ltd. (Rs.) |
|---|---|---|
| Equity share capital | 6,00,000 | 8,00,000 |
| Reserves and surplus | 3,00,000 | 2,50,000 |
| Current liabilities | 1,00,000 | 1,50,000 |
| Total | 10,00,000 | 12,00,000 |
| Fixed assets | 4,00,000 | 7,00,000 |
| Current assets | 6,00,000 | 5,00,000 |
| Total | 10,00,000 | 12,00,000 |
Free with a Super Tutor account
20 more solved questions in Analysis of Financial Statements
They are free with a Super Tutor account, along with practice quizzes and flashcards for this chapter. Free to start, no card needed.
Frequently Asked Questions
What are the important topics in Analysis of Financial Statements for Madhya Pradesh Board Class 12 Accountancy?
Are these NCERT Solutions for Analysis of Financial Statements free?
How should I revise Analysis of Financial Statements for the Madhya Pradesh Board Class 12 board exam?
Sources & Official References
Content is aligned to the official syllabus. Refer to the board website for the latest curriculum.
More resources for Analysis of Financial Statements
Practice Quiz
Test yourself with a quick quiz
Important Questions
Exam-style questions with answers
Revision Notes
Key points for last-minute revision
Chapter Summary
Understand the chapter at a glance
Concept Maps
See how topics connect
Study Plan
Step-by-step plan for this chapter
Flashcards
Quick-fire cards for active recall
Syllabus
What topics to cover
For serious students
Get the full Analysis of Financial Statements chapter — start free.
Quizzes, flashcards, an AI doubt solver and a study plan for Madhya Pradesh Board Class 12 Accountancy. Free to start, no card needed.