Market Equilibrium — NCERT Solutions
Madhya Pradesh Board · Class 12 · Economics
NCERT Solutions for Market Equilibrium, Madhya Pradesh Board Class 12 Economics: 25 textbook questions solved step by step.
Interactive on Super Tutor
Studying Market Equilibrium? Get the full interactive chapter.
Quizzes, flashcards, AI doubt-solver and a step-by-step study plan — built for NCERT solutions and more.
Free trial, no card needed.
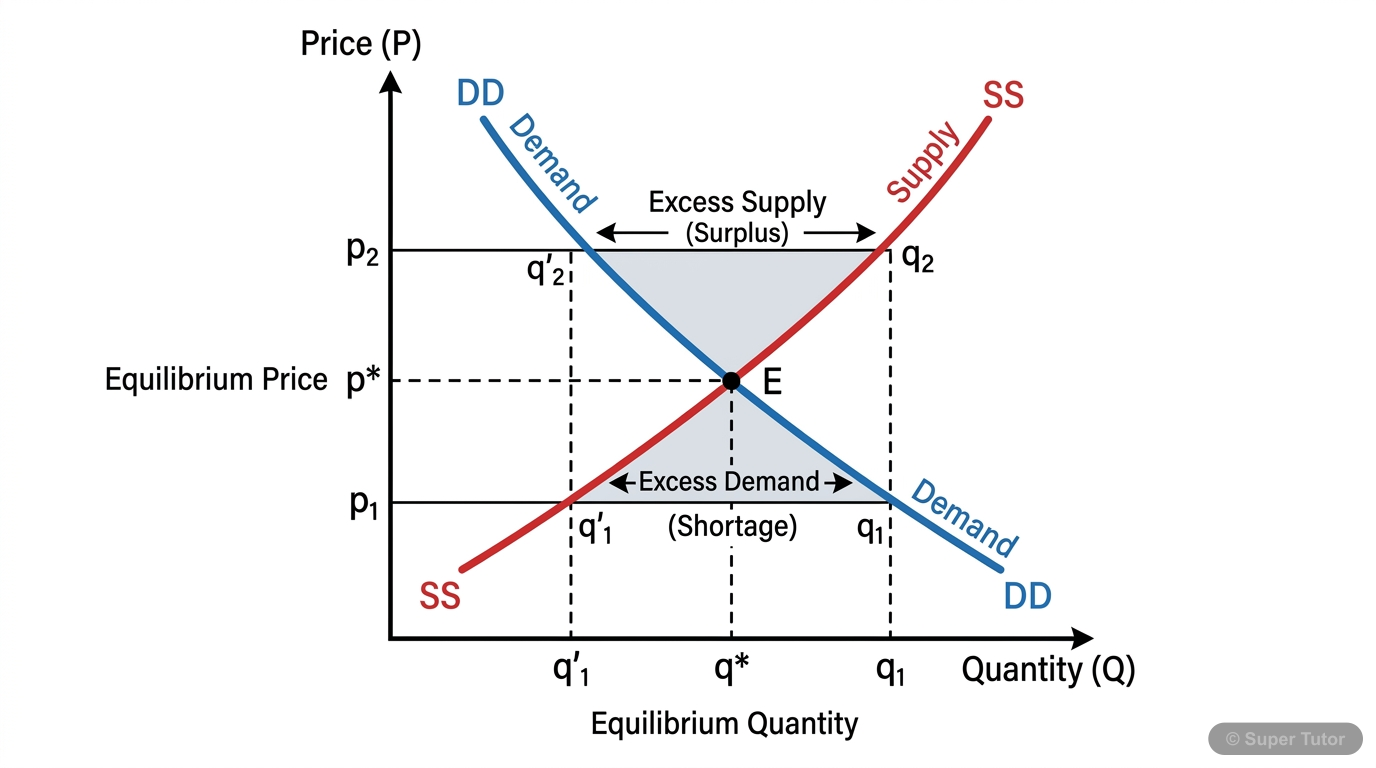
One of 11 illustrations for Market Equilibrium in Super Tutor — alongside flashcards, concept maps and practice questions.
The first 13 solutions are open to read. The other 12 are free with a Super Tutor account.
Exercises — Chapter 5: Market Equilibrium
1Explain market equilibrium.Show solution
Market Equilibrium is a situation in a market where the quantity demanded by buyers exactly equals the quantity supplied by sellers at a particular price. This price is called the equilibrium price () and the corresponding quantity is called the equilibrium quantity ().
Concept: At equilibrium, there is no tendency for price to change because the market clears — there is neither excess demand nor excess supply.
Determination:
The equilibrium is determined at the intersection of the market demand curve and the market supply curve.
- If the prevailing market price : quantity supplied exceeds quantity demanded → excess supply → price falls back to .
- If the prevailing market price : quantity demanded exceeds quantity supplied → excess demand → price rises back to .
Thus, the market has a self-correcting mechanism that always pushes price toward equilibrium.
2When do we say there is excess demand for a commodity in the market?Show solution
Excess Demand occurs when, at the prevailing market price, the quantity demanded by buyers is greater than the quantity supplied by sellers.
This situation arises when the prevailing price is below the equilibrium price ().
Consequence: Since buyers want more than what is available, they compete with each other and are willing to pay a higher price. This competition among buyers pushes the price upward until it reaches the equilibrium price , where excess demand is eliminated.
Example: If equilibrium price is ₹10 but the market price is ₹7, buyers demand more units than sellers are willing to supply at ₹7, creating excess demand.
3When do we say there is excess supply for a commodity in the market?Show solution
Excess Supply occurs when, at the prevailing market price, the quantity supplied by sellers is greater than the quantity demanded by buyers.
This situation arises when the prevailing price is above the equilibrium price ().
Consequence: Since sellers are unable to sell all they wish to supply, they compete with each other and are willing to accept a lower price. This competition among sellers pushes the price downward until it reaches the equilibrium price , where excess supply is eliminated.
Example: If equilibrium price is ₹10 but the market price is ₹13, sellers supply more units than buyers are willing to purchase at ₹13, creating excess supply.
4What will happen if the price prevailing in the market is (i) above the equilibrium price? (ii) below the equilibrium price?Show solution
(i) Price above equilibrium price ():
Given: Prevailing price (equilibrium price).
Effect: At this higher price, quantity supplied quantity demanded, leading to excess supply (unsold stocks accumulate with sellers).
Adjustment: Sellers, unable to sell their entire stock, will lower their prices to attract buyers. This process continues until the price falls back to , where and the market clears.
(ii) Price below equilibrium price ():
Given: Prevailing price (equilibrium price).
Effect: At this lower price, quantity demanded quantity supplied, leading to excess demand (shortage in the market).
Adjustment: Buyers, unable to obtain the desired quantity, will bid up the price. Sellers, seeing strong demand, will also raise prices. This process continues until the price rises back to , where and the market clears.
Conclusion: In both cases, market forces automatically restore equilibrium at .
5Explain how price is determined in a perfectly competitive market with fixed number of firms.Show solution
Given: A perfectly competitive market with a fixed number of firms.
Step 1 — Market Demand Curve:
The market demand curve is downward sloping, showing that as price falls, quantity demanded increases.
Step 2 — Market Supply Curve:
With a fixed number of firms, the market supply curve is obtained by the horizontal summation of individual firms' supply curves. It is upward sloping — as price rises, each firm supplies more.
Step 3 — Equilibrium Determination:
Equilibrium is determined at the point where:
This is the intersection of the market demand curve and the market supply curve.
- The price at this intersection is the equilibrium price .
- The quantity at this intersection is the equilibrium quantity .
Step 4 — Stability:
- If : excess supply → price falls toward .
- If : excess demand → price rises toward .
Thus, with a fixed number of firms, the equilibrium price and quantity are uniquely determined by the intersection of market demand and market supply curves.
6Suppose the price at which equilibrium is attained in exercise 5 is above the minimum average cost of the firms constituting the market. Now if we allow for free entry and exit of firms, how will the market price adjust to it?Show solution
Given: Equilibrium price minimum average cost (min AC) of firms; free entry and exit is now allowed.
Step 1 — Existence of Supernormal Profits:
Since min AC, firms in the market are earning supernormal (positive economic) profits.
Step 2 — Entry of New Firms:
Attracted by these supernormal profits, new firms will enter the market.
Step 3 — Shift in Supply Curve:
As new firms enter, the market supply curve shifts rightward (supply increases).
Step 4 — Fall in Price:
With demand unchanged, the rightward shift in supply causes the equilibrium price to fall.
Step 5 — Long-Run Equilibrium:
This process of entry continues until the price falls to the minimum average cost of the firms, i.e., min AC.
At this point, firms earn only normal profits (zero economic profit), so there is no further incentive for new firms to enter.
Conclusion: With free entry and exit, the market price adjusts downward from to the minimum average cost of the firms, which becomes the new long-run equilibrium price.
7At what level of price do the firms in a perfectly competitive market supply when free entry and exit is allowed in the market? How is equilibrium quantity determined in such a market?Show solution
Price Level with Free Entry and Exit:
With free entry and exit in a perfectly competitive market with identical firms, the equilibrium price is always equal to the minimum average cost (min AC) of the firms.
Reason:
- If min AC → supernormal profits → new firms enter → supply increases → price falls to min AC.
- If min AC → losses → firms exit → supply decreases → price rises to min AC.
Thus:
Determination of Equilibrium Quantity:
Once the equilibrium price is fixed at min AC, the equilibrium quantity is determined by the market demand curve.
In other words, at the price equal to minimum average cost, we read off the quantity demanded from the market demand curve — that quantity is the equilibrium quantity supplied in the market.
Summary:
- Equilibrium price = min AC (supply side determines price).
- Equilibrium quantity = quantity demanded at that price (demand side determines quantity).
8How is the equilibrium number of firms determined in a market where entry and exit is permitted?Show solution
Given: Free entry and exit; identical firms; equilibrium price = min AC.
Step 1: With free entry and exit, the equilibrium price is fixed at min AC.
Step 2: At this price, the equilibrium quantity is determined by the market demand curve:
Step 3: Each individual firm produces at the output level corresponding to its minimum average cost. Let this output per firm be (the output at which AC is minimised).
Step 4: The equilibrium number of firms () is determined by dividing the total equilibrium quantity by the output per firm:
Conclusion: The equilibrium number of firms equals the total market equilibrium quantity divided by the output produced by each individual firm at minimum average cost. If demand increases, rises and more firms enter; if demand decreases, falls and some firms exit.
9How are equilibrium price and quantity affected when income of the consumers (a) increase? (b) decrease?Show solution
(a) When income of consumers increases:
Assumption: The good is a normal good (most goods fall in this category).
Effect on Demand: As income rises, consumers demand more of the good at every price → demand curve shifts rightward.
Effect on Equilibrium (supply unchanged):
- Equilibrium price increases (rises from to ).
- Equilibrium quantity increases (rises from to ).
(b) When income of consumers decreases:
Effect on Demand: As income falls, consumers demand less of the good at every price → demand curve shifts leftward.
Effect on Equilibrium (supply unchanged):
- Equilibrium price decreases (falls from to ).
- Equilibrium quantity decreases (falls from to ).
Note: For an inferior good, the effects would be reversed — higher income reduces demand, shifting the demand curve leftward.
10Using supply and demand curves, show how an increase in the price of shoes affects the price of a pair of socks and the number of pairs of socks bought and sold.Show solution
Concept: Shoes and socks are complementary goods — they are consumed together.
Step 1 — Effect of rise in price of shoes:
When the price of shoes increases, the demand for shoes falls (law of demand).
Step 2 — Effect on demand for socks:
Since shoes and socks are complements, a fall in demand for shoes leads to a fall in demand for socks as well. The demand curve for socks shifts leftward (from to ).
Step 3 — Effect on equilibrium in socks market:
With the supply curve of socks unchanged:
- The demand curve shifts left.
- New equilibrium is at a lower price and lower quantity.
Diagram Description:
- Draw the socks market with original demand and supply , intersecting at .
- Shift demand leftward to .
- New equilibrium at where and .
Conclusion:
- Equilibrium price of socks falls.
- Equilibrium quantity (number of pairs) of socks bought and sold falls.
11How will a change in price of coffee affect the equilibrium price of tea? Explain the effect on equilibrium quantity also through a diagram.Show solution
Concept: Tea and coffee are substitute goods — if the price of one rises, consumers switch to the other.
Case: Price of coffee increases
Step 1: When the price of coffee rises, coffee becomes relatively more expensive.
Step 2: Consumers substitute tea for coffee → demand for tea increases → demand curve for tea shifts rightward (from to ).
Step 3 — Effect on equilibrium in tea market (supply unchanged):
Diagram:
- X-axis: Quantity of tea; Y-axis: Price of tea.
- Original equilibrium at intersection of and at .
- Demand shifts right to .
- New equilibrium at intersection of and at .
- and .
Conclusion:
- Equilibrium price of tea increases (from to ).
- Equilibrium quantity of tea increases (from to ).
Case: Price of coffee decreases — Demand for tea shifts leftward → equilibrium price and quantity of tea both decrease.
12How do the equilibrium price and quantity of a commodity change when price of input used in its production changes?Show solution
Concept: The price of inputs (raw materials, labour, etc.) affects the cost of production, which in turn affects the supply of the commodity.
Case 1: Price of input increases
- Cost of production rises → firms are willing to supply less at every price → supply curve shifts leftward (from to ).
- With demand unchanged, leftward shift in supply causes:
- Equilibrium price increases (from to ).
- Equilibrium quantity decreases (from to ).
Case 2: Price of input decreases
- Cost of production falls → firms are willing to supply more at every price → supply curve shifts rightward (from to ).
- With demand unchanged, rightward shift in supply causes:
- Equilibrium price decreases (from to ).
- Equilibrium quantity increases (from to ).
Conclusion: A rise in input price raises equilibrium price and reduces equilibrium quantity; a fall in input price reduces equilibrium price and raises equilibrium quantity.
13If the price of a substitute (Y) of good X increases, what impact does it have on the equilibrium price and quantity of good X?Show solution
Given: Good Y is a substitute for good X. Price of Y increases.
Step 1 — Effect on demand for X:
When the price of substitute Y rises, good X becomes relatively cheaper. Consumers shift their demand from Y to X → demand for X increases → demand curve of X shifts rightward (from to ).
Step 2 — Effect on equilibrium of X (supply of X unchanged):
With the supply curve of X unchanged:
- The rightward shift in demand leads to a new equilibrium at a higher price and higher quantity.
Step 3 — Results:
Conclusion: An increase in the price of substitute good Y causes both the equilibrium price and equilibrium quantity of good X to increase.
Free with a Super Tutor account
Free with a Super Tutor account
Free with a Super Tutor account
Free with a Super Tutor account
Free with a Super Tutor account
Free with a Super Tutor account
Free with a Super Tutor account
Free with a Super Tutor account
Free with a Super Tutor account
Free with a Super Tutor account
Free with a Super Tutor account
Free with a Super Tutor account
12 more solved questions in Market Equilibrium
They are free with a Super Tutor account, along with practice quizzes and flashcards for this chapter. Free to start, no card needed.
Frequently Asked Questions
What are the important topics in Market Equilibrium for Madhya Pradesh Board Class 12 Economics?
Are these NCERT Solutions for Market Equilibrium free?
How should I revise Market Equilibrium for the Madhya Pradesh Board Class 12 board exam?
Sources & Official References
Content is aligned to the official syllabus. Refer to the board website for the latest curriculum.
More resources for Market Equilibrium
Practice Quiz
Test yourself with a quick quiz
Important Questions
Exam-style questions with answers
Revision Notes
Key points for last-minute revision
Formula Sheet
The chapter's formulas in one place
Chapter Summary
Understand the chapter at a glance
Concept Maps
See how topics connect
Study Plan
Step-by-step plan for this chapter
Flashcards
Quick-fire cards for active recall
Syllabus
What topics to cover
For serious students
Get the full Market Equilibrium chapter — start free.
Quizzes, flashcards, an AI doubt solver and a study plan for Madhya Pradesh Board Class 12 Economics. Free to start, no card needed.